- The US dollar bounced back, ending a three-week decline, thanks to strong employment data and interest rate projections.
- Key economic indicators and central bank meetings, including the Fed, ECB, and others, will impact the direction of the dollar index in the coming week.
- Meanwhile, EUR/USD faced resistance at 1.1, signaling a pause in its recovery; potential buying opportunities may arise if support at 1.075 holds.
US dollar rose by 0.77% last week, ending the last 3-week downtrend.
US Employment data released last week came in above expectations, showing that the labor force remains strong. This led to a slight change in the interpretations about the path of interest rate policy in the coming year Fed and finally, a partial upward movement was seen in the US dollar and bond yields last week.
This week's data releases and messages from central banks may cause volatility in the forex market. First of all, US CPI data will be followed tomorrow. Core inflation is expected to remain stable at 4% on an annual basis, while CPI is expected to fall slightly to 3.1%.
Following the strong employment data, the CPI is also expected to be above expectations, which may lead to a more hawkish tone in the Fed's speech, even though it is certain that the Fed will leave interest rates unchanged this month. This would lead the market to extend its expectations for the pivot rate period and thus the dollar could strengthen further into the new year.
In recent weeks, a correction phase in the dollar took place as speculation accelerated that the Fed might cut interest rates in the first quarter of the year. However, the expectation of a rate cut was pushed back to after the 3rd quarter of 2024 after the latest data, which weakened the correction phase in the dollar index.
Nevertheless, this week's data and the results of the meetings of the European Central Bank, the Bank of England, Norges Bank, and the Swiss National Bank, along with the Fed, may be decisive for the direction of the index.
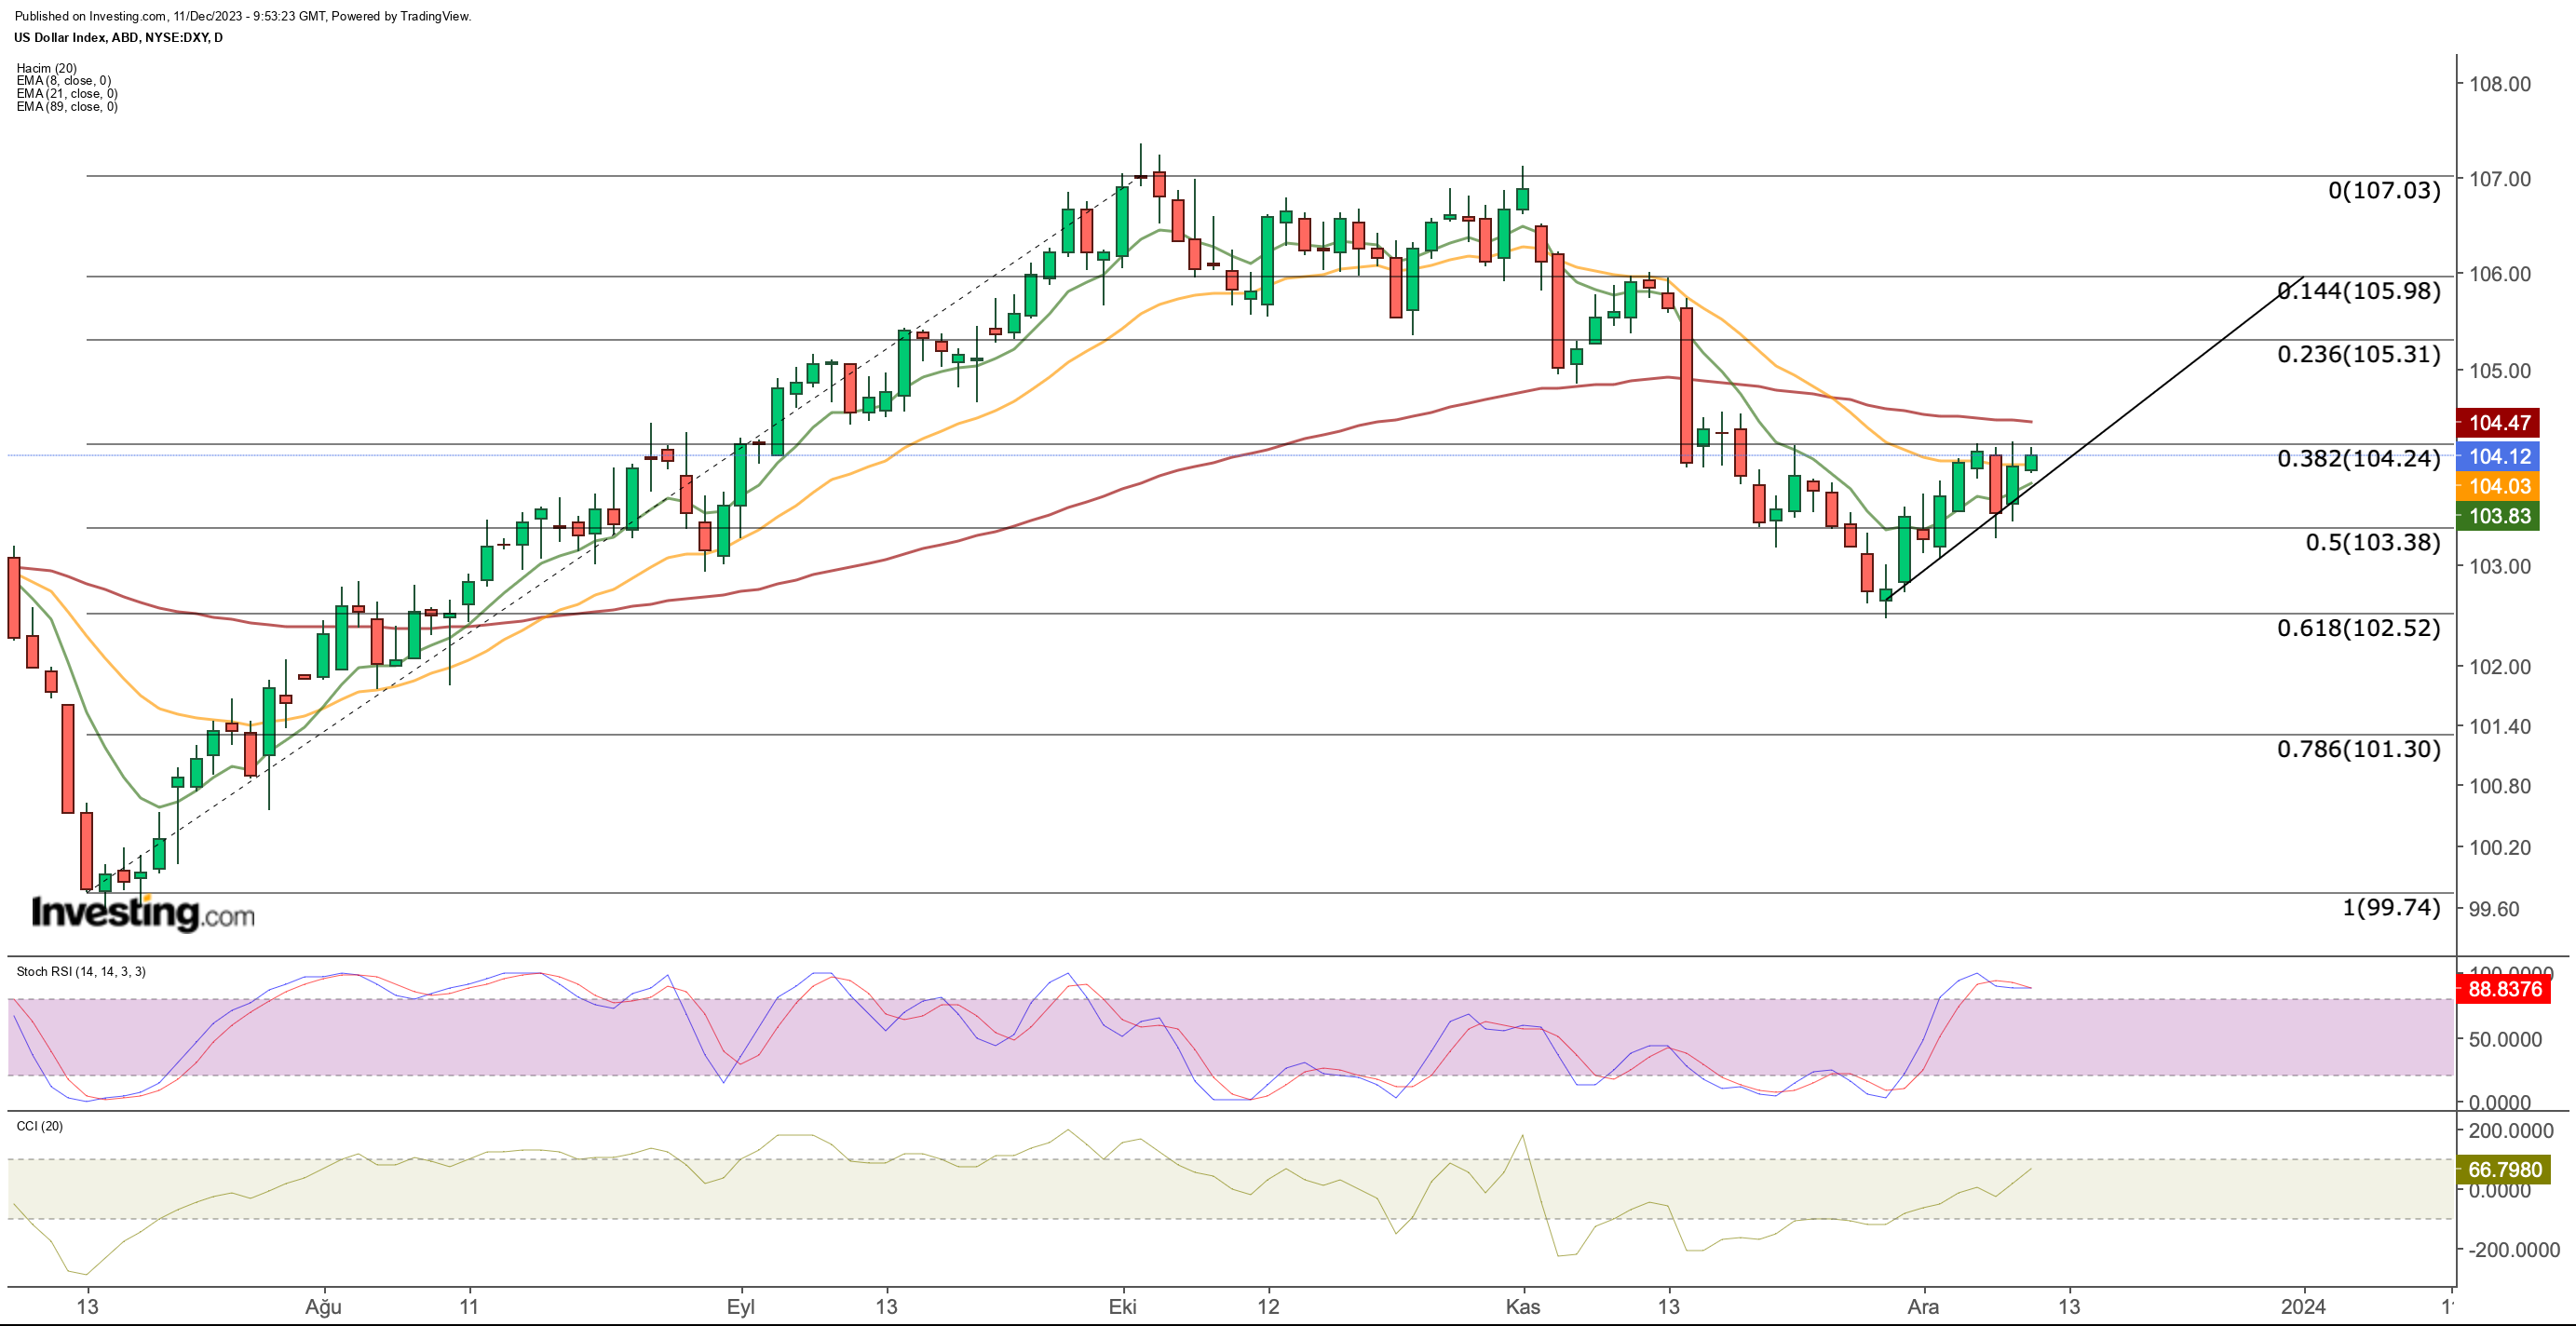
If we look at the DXY from a technical point of view; The first striking view is that the retreat that started from the 107 band lasted until the 102 level and was supported at Fib 0.618 according to the last upward momentum.
On the daily chart, it is seen that after the dollar index made a technically ideal correction, a clear resistance was formed at 104.2 in the upward swing. If this resistance line, which extends up to 104.5, can be broken this week, we can see that the DXY can settle in the 105 - 107 band again.

On the other hand, developments such as neutral CPI data and a dovish Powell statement may support the risk appetite and lead to a new easing in the dollar. In this case, 103.8 will be followed as the closest support. In a possible retreat, we can see that the 102.5 level can be tested once again. Below this support level, the dollar index is likely to fall to 101.3.
In summary, for the dollar to continue to strengthen, it needs to create ground above 104.5 this week. Otherwise, we can see that the correction momentum may continue.
EUR/USD's Recovery Halts: Can the Pair Regain Momentum?
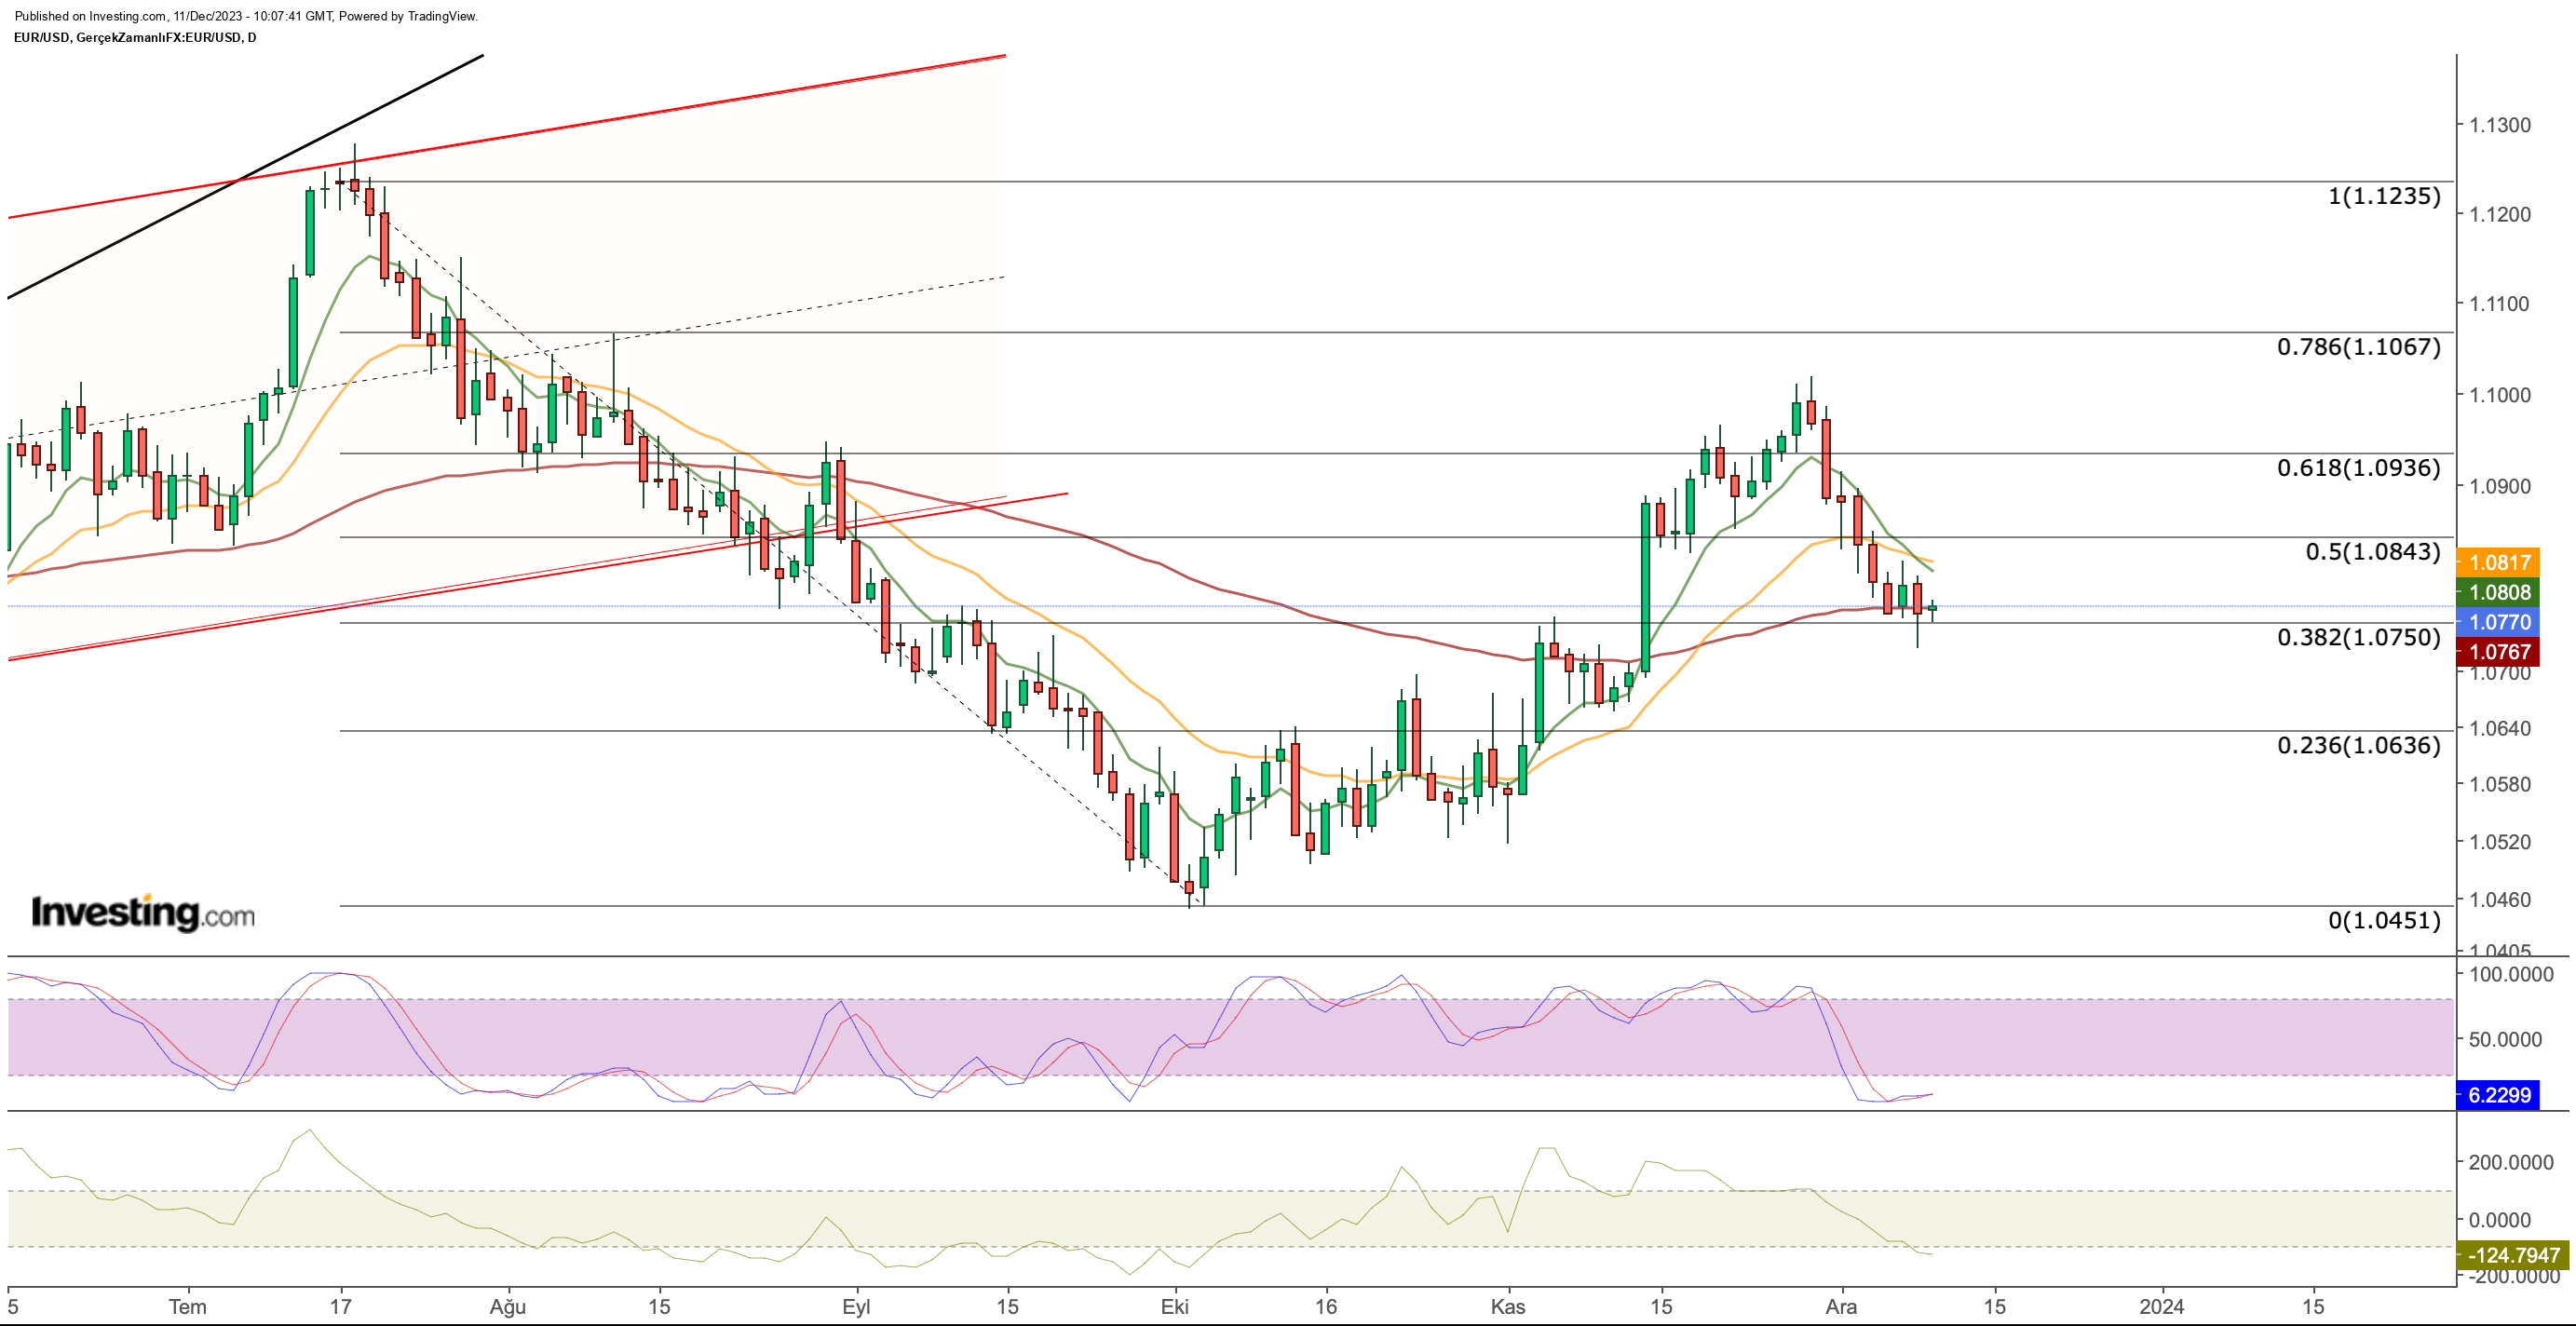
With the dollar in demand again towards December, we saw that the EUR/USD parity interrupted its recovery trend at the 1.1 level. In the retreat that started in the last days of November, EUR/USD has found support at 1.075 as of now.
Technically, there are mixed signals for the pair. Short-term EMA values signal that the downward momentum may continue, while the Stochastic RSI indicator remains flat at the bottom of the oversold zone.
Accordingly, as long as 1.075 support remains intact, EUR/USD may see reaction buying towards 1.085 this week with support from current levels. If this price level is exceeded with daily closes, it may lead to a new momentum towards 1.09 and then 1.11 on average, depending on the increase in euro demand. In the lower region, below 1.075, the 1.06 band will come to the agenda as the next support line.
Gold: Bears in Charge as Yellow Metal Tumbles
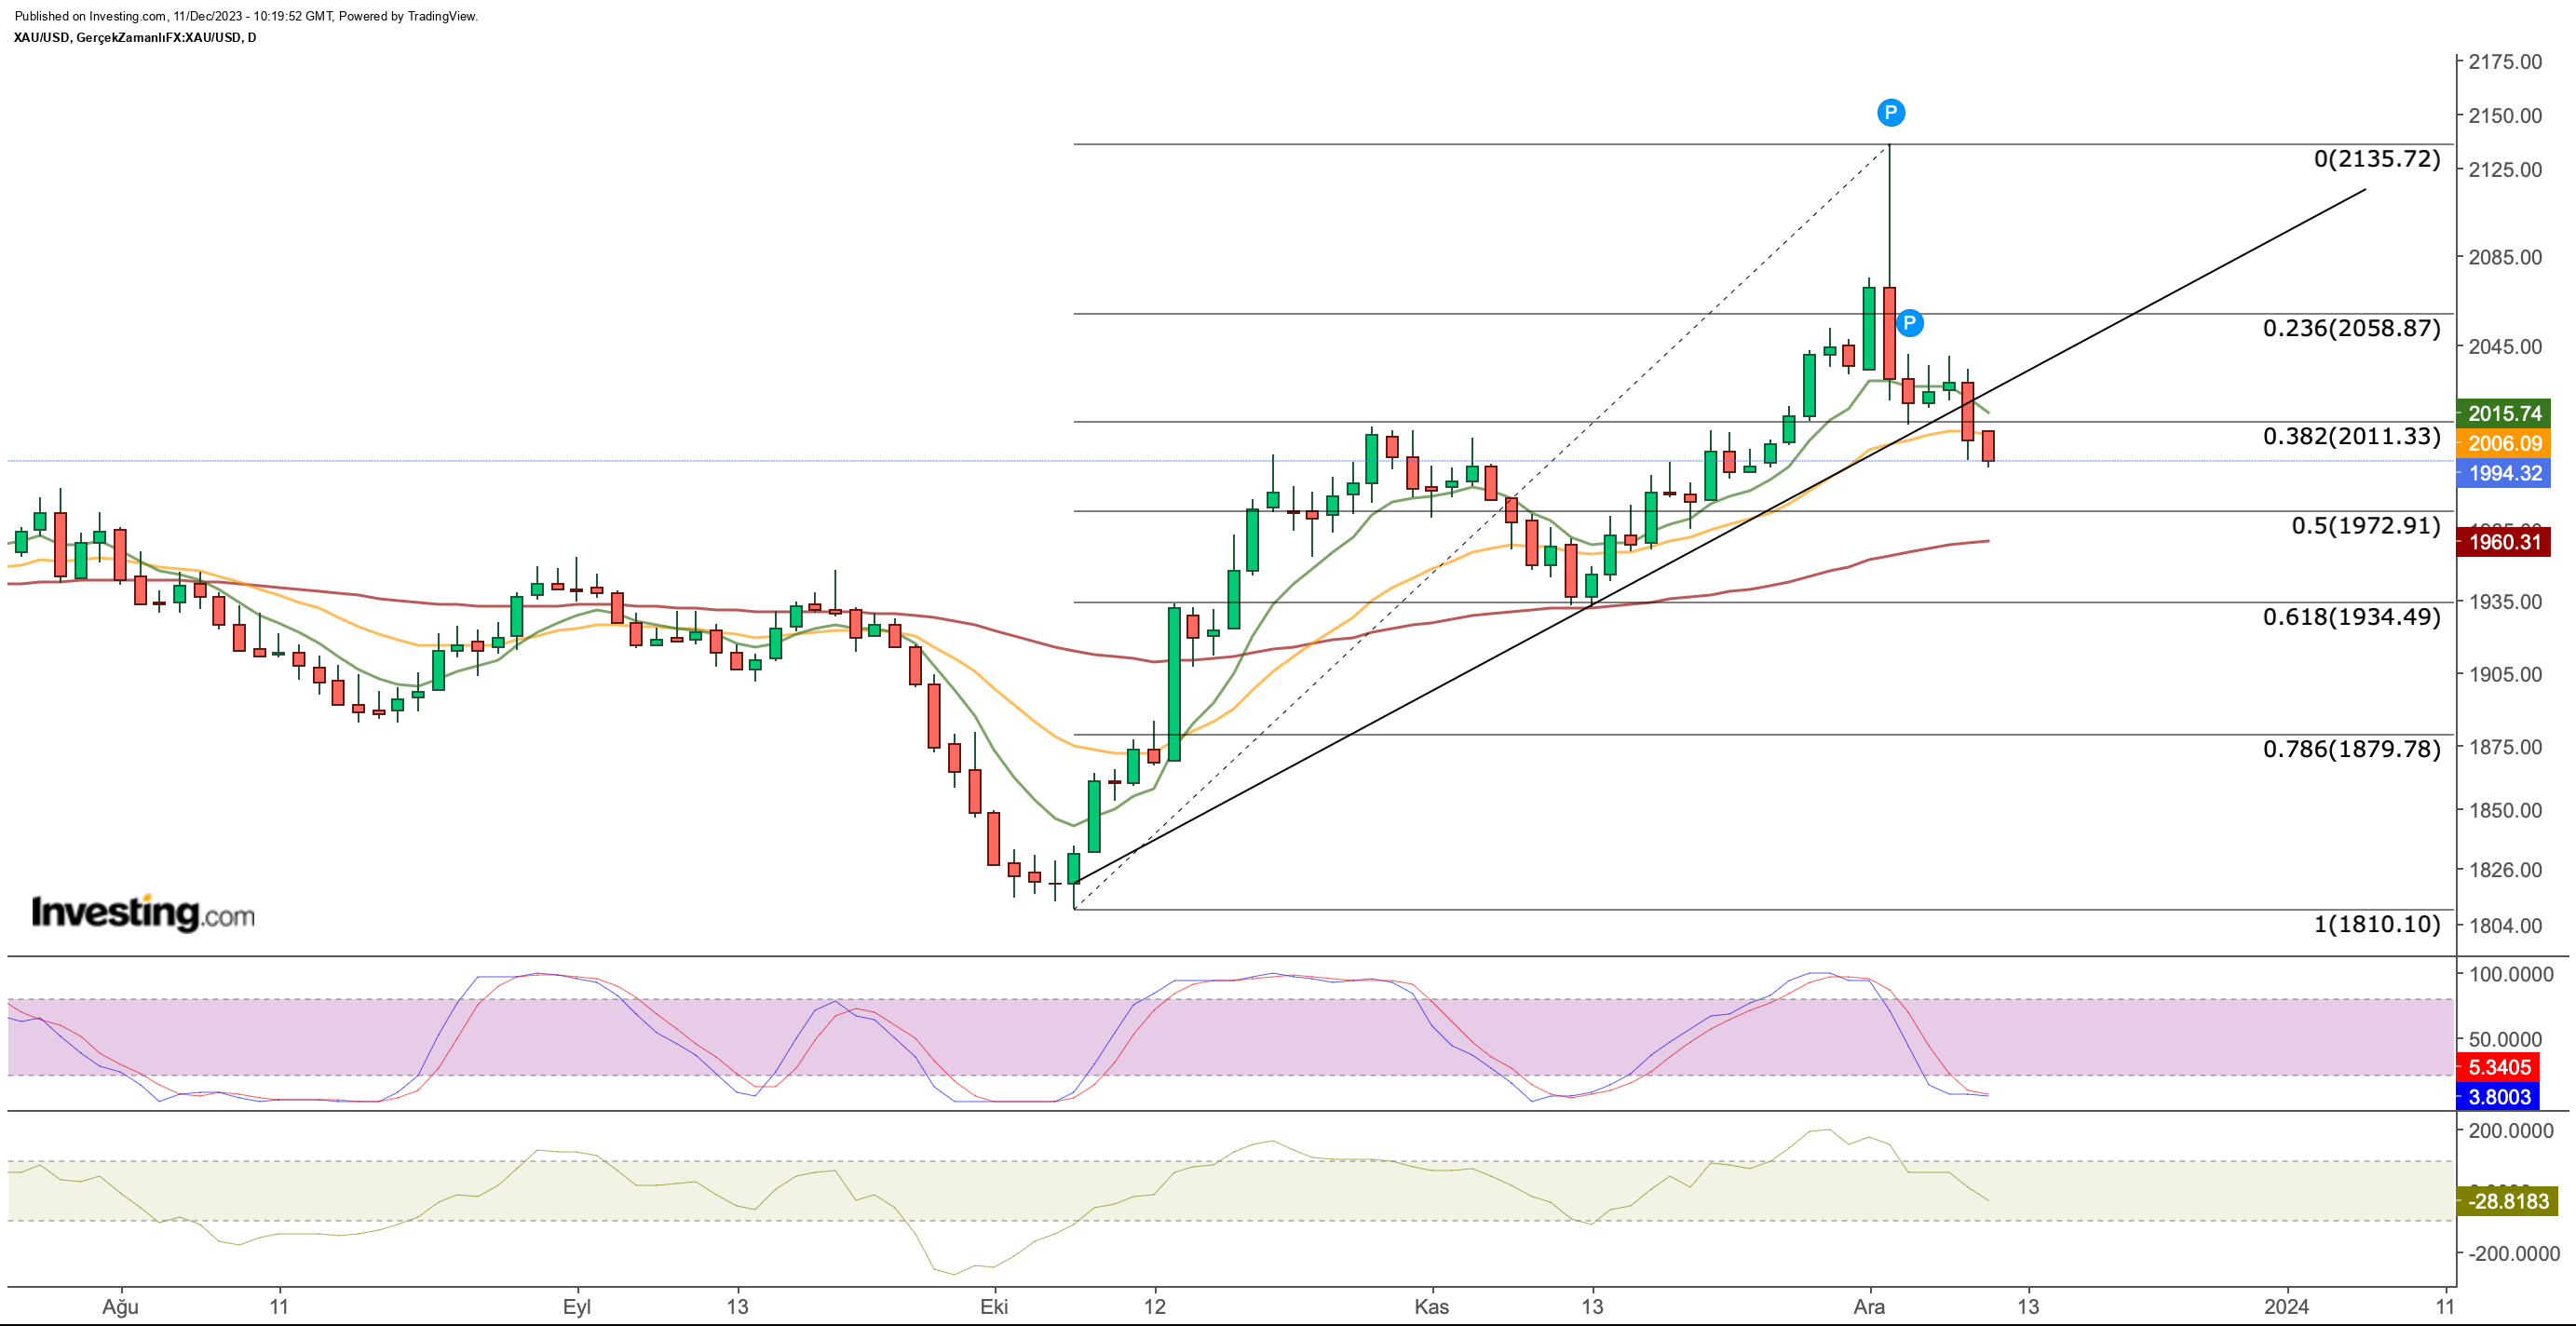
Gold, which started the week with sellers, has fallen below $ 2,000. While the dollar has been more robust in recent days, gold entered a downward trend with rapid sales after reaching a peak at $ 2,135 after its jump at the beginning of last week.

The yellow metal quickly turned its direction upwards with the increasing geopolitical risk in October, recorded a significant rise in the short-lived panic caused by the end of the ceasefire between Israel and Hamas last week.
Then, gold, which declined with the effect of the dollar due to the developments that remained calm throughout the week, has an outlook that continues towards the next support line of $ 1,970 after closing the week under the support of $ 2,010.
While it is seen that the current momentum may continue towards the range of $ 1,960 - $ 1,970 in the short term, these levels can be considered as a buying opportunity by investors. A support that may come from this point may trigger gold to move towards the $ 2,100 band again.
***
You can easily determine whether a company is suitable for your risk profile by conducting a detailed fundamental analysis on InvestingPro according to your criteria. This way, you will get highly professional help in shaping your portfolio.
You can sign up for InvestingPro, one of the most comprehensive platforms in the market for portfolio management and fundamental analysis by clicking on the banner below
Disclaimer: This article is written for informational purposes only; it does not constitute a solicitation, offer, advice, or recommendation to invest as such it is not intended to incentivize the purchase of assets in any way. I would like to remind you that any type of asset, is evaluated from multiple points of view and is highly risky and therefore, any investment decision and the associated risk remains with the investor.

