This article was written exclusively for Investing.com
- New modern-day high in March
- The ratio turns lower
- Memories of 2008-2011 in the silver and gold markets, and the ratio
The silver:gold ratio dates back thousands of years. In around 3000BC, the first Egyptian Pharaoh, Menes, declared that two and one-half parts silver equals one-part gold.
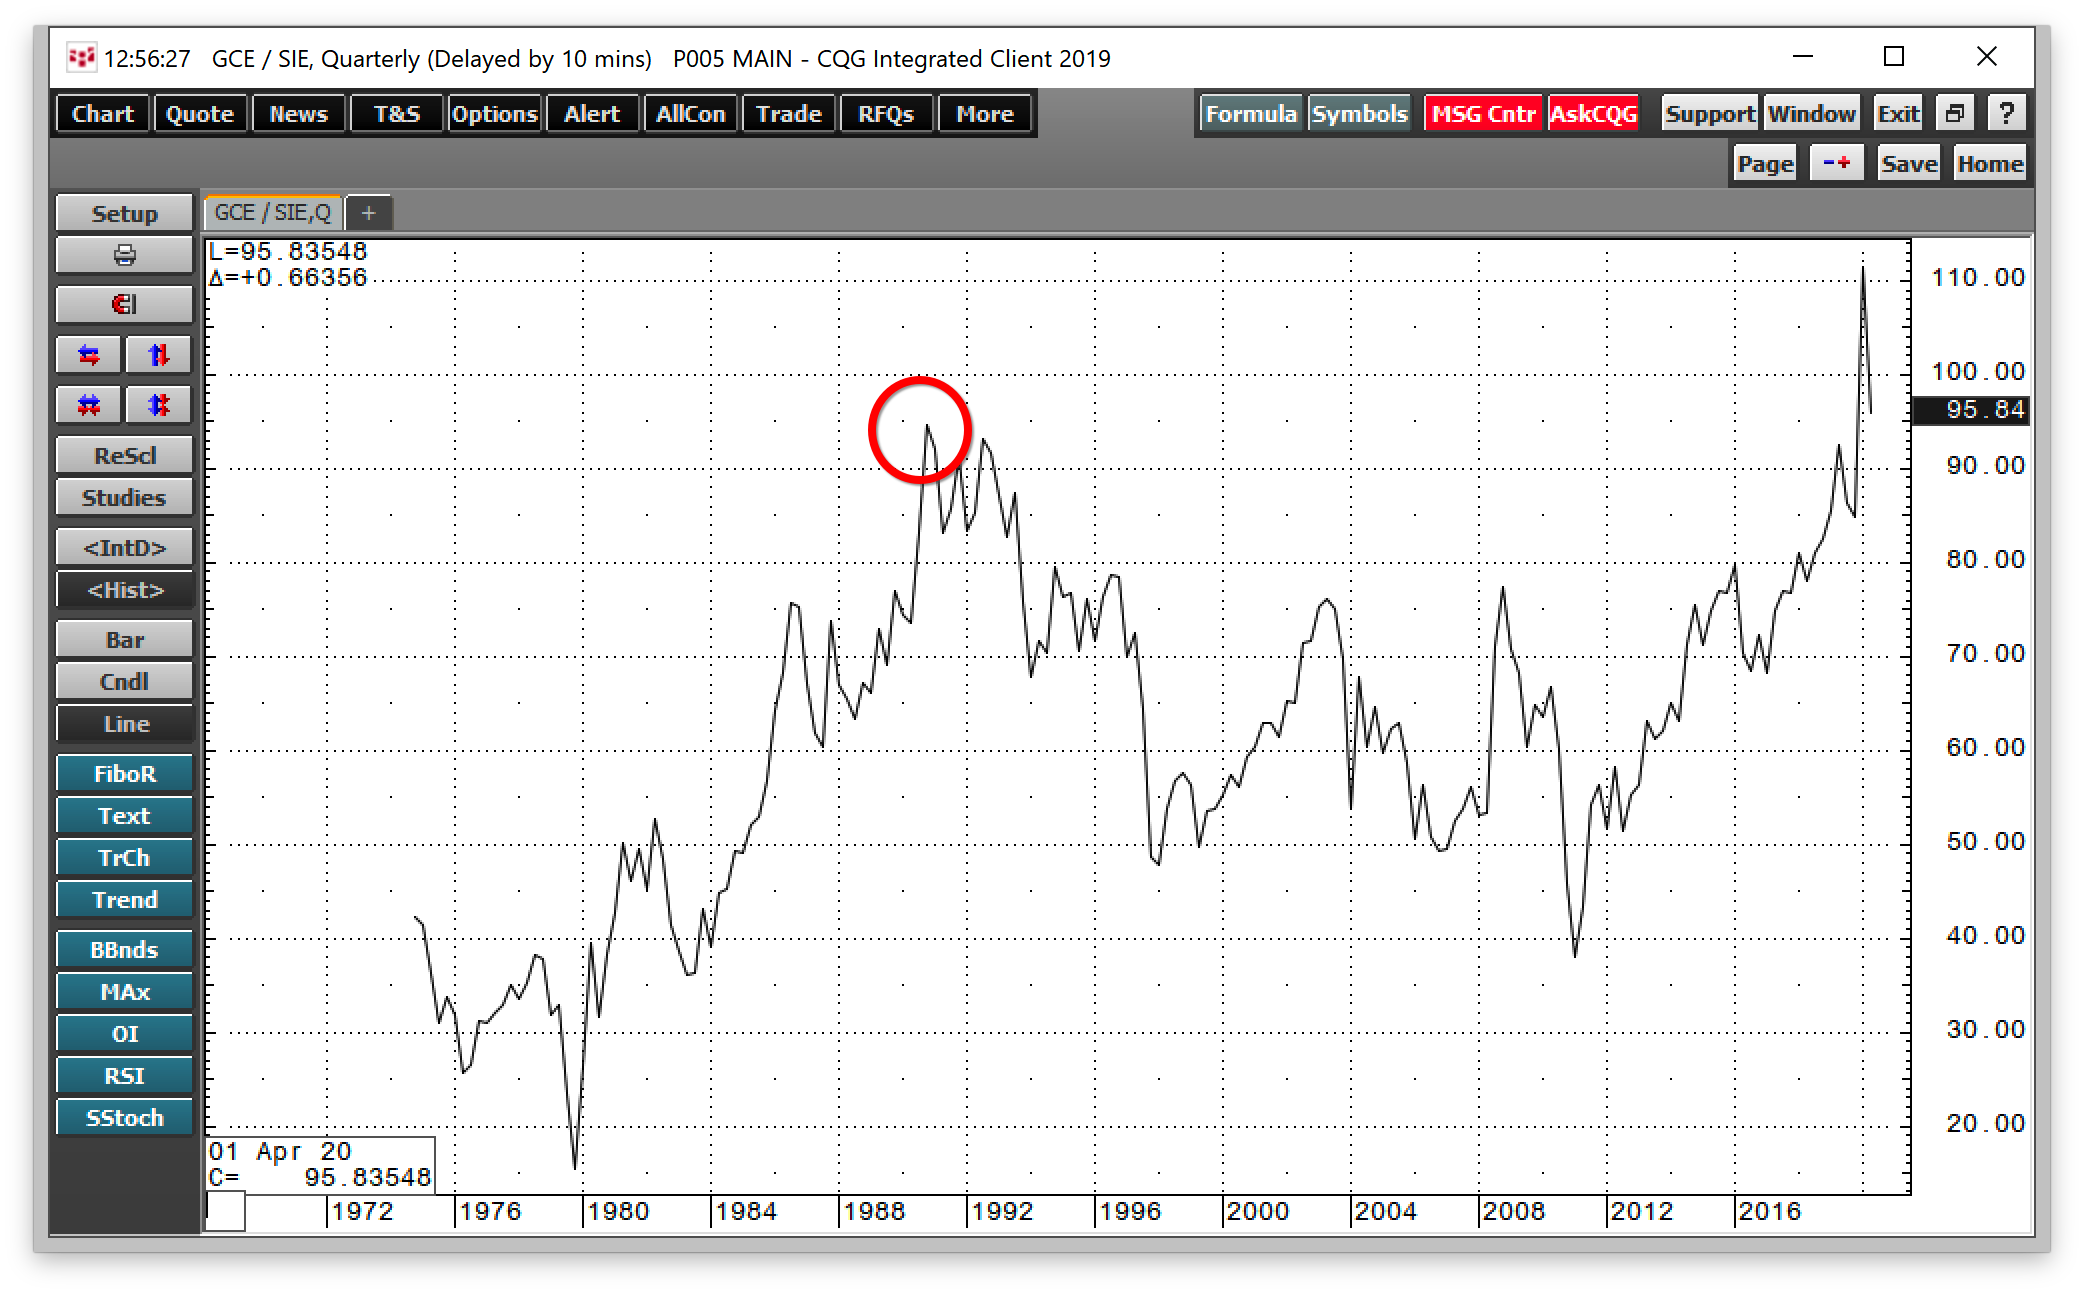
In modern times, since silver and gold began trading on the COMEX futures exchange, the average of the price relationship between the two precious metals had been around the 55:1 level, where it also stood at the beginning of 2020. The high came in 1990 and the low in 1979. When the ratio is below the average level, silver is historically cheap compared to gold; when it's above, the white metal is considered expensive.
The ratio is an inter-commodity spread, but it reflects the potential for substitution between the two metals. Gold and silver have long histories as both commodities and currencies. For centuries, and before biblical times, gold and silver were symbols of wealth and money. In the US, one of the leading issues during the 1896 Presidential election between William McKinley and William Jennings Bryan was whether to use gold or silver as backing for the US dollar. McKinley and gold won the election.
In March, risk-off conditions in markets across all asset classes pushed the price of silver to the lowest level since 2009 when it fell below $12 per ounce. The move propelled the silver:gold ratio to a new all-time peak.
New modern-day high in March

Source, all charts: CQG
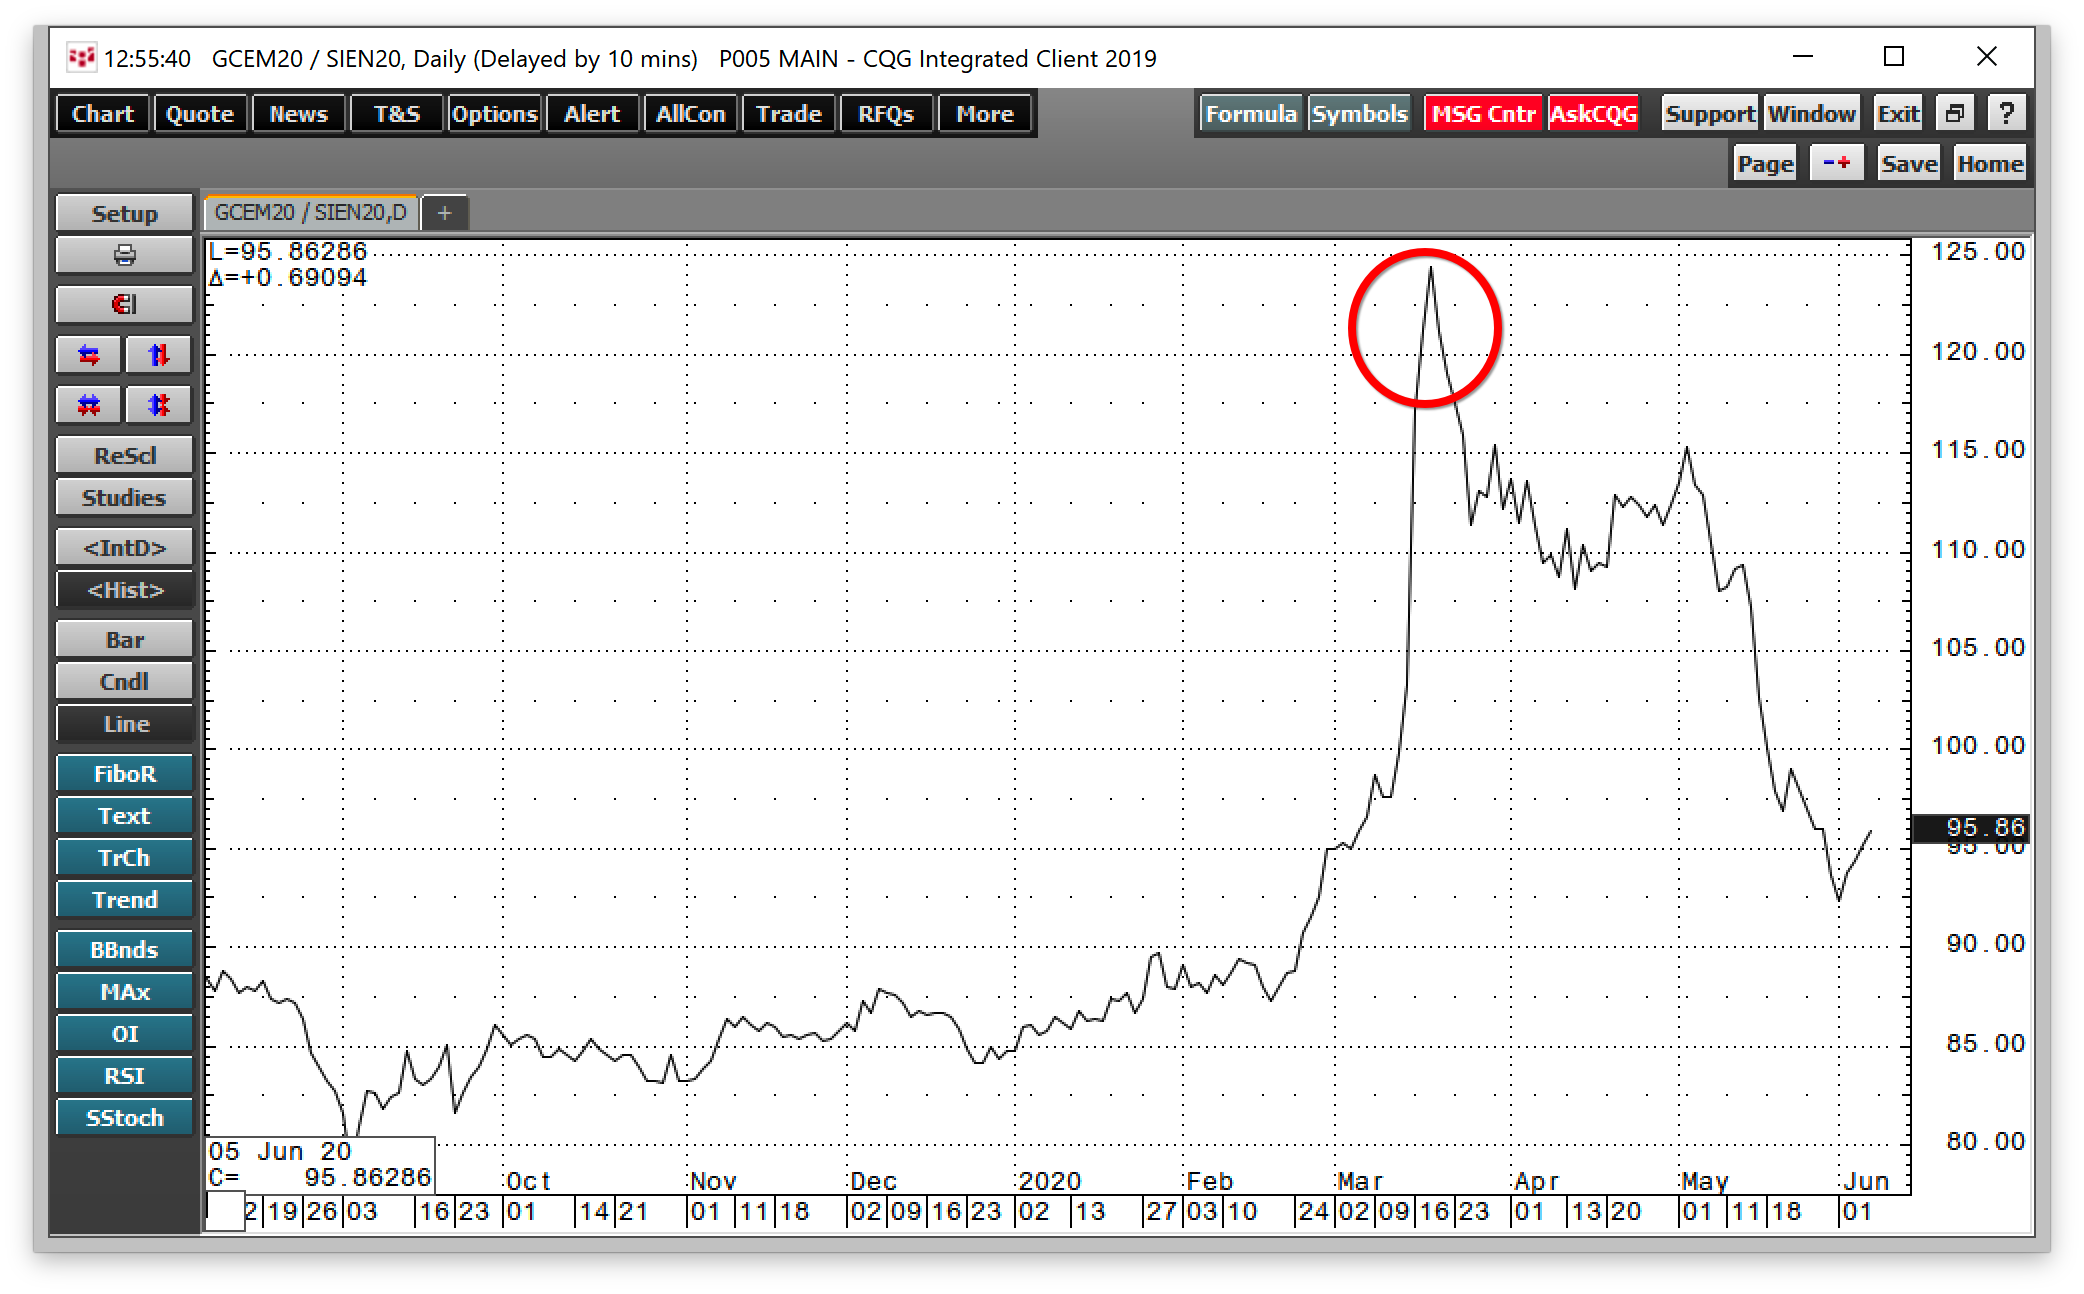
The daily chart of June COMEX gold futures divided by July COMEX silver futures, above, shows the ratio's peak in March.

The relationship reached a high of 124.4 ounces of silver value to each ounce of gold value on March 18. The quarterly chart illustrates the previous high in 1990 that was below the 95:1 level in the ratio.
The ratio turns lower
The ratio has declined steadily since the March high, reaching its most recent low at 92.32:1 on June 1. Last Friday, it was trading below the 96:1 level.
Historically, the ratio tends to rise during periods when there's a bear market and fall during bullish trends. The low at 15.47:1 came in 1979 when silver was on its way to $50.36 and gold to $875. At the time, those prices were record highs. By 2011 the ratio fell to a low of 38:1. Three years after the 2008 financial crisis, silver was moving towards its most recent high of $49.82 and gold to its record peak at $1920.70 per ounce.
In 1990, at the previous high in the ratio, gold and silver traded to respective lows of $346 and $3.93 per ounce. Time will tell if the turn lower in the ratio is a sign that higher prices are on the horizon.
Memories of 2008-2011 in the silver and gold markets, and the ratio
Perhaps the most compelling bullish case for gold and silver is the unprecedented level of central bank and government stimulus flowing into the financial system in 2020. From June to September 2008, the US Treasury borrowed a record $530 billion to fund economic stimulus. During May 2020, the Treasury had already spent $3 trillion, more than five times that amount.
That liquidity was rocket fuel for the silver and gold markets from 2008 through 2011. The same might be true for the coming years.
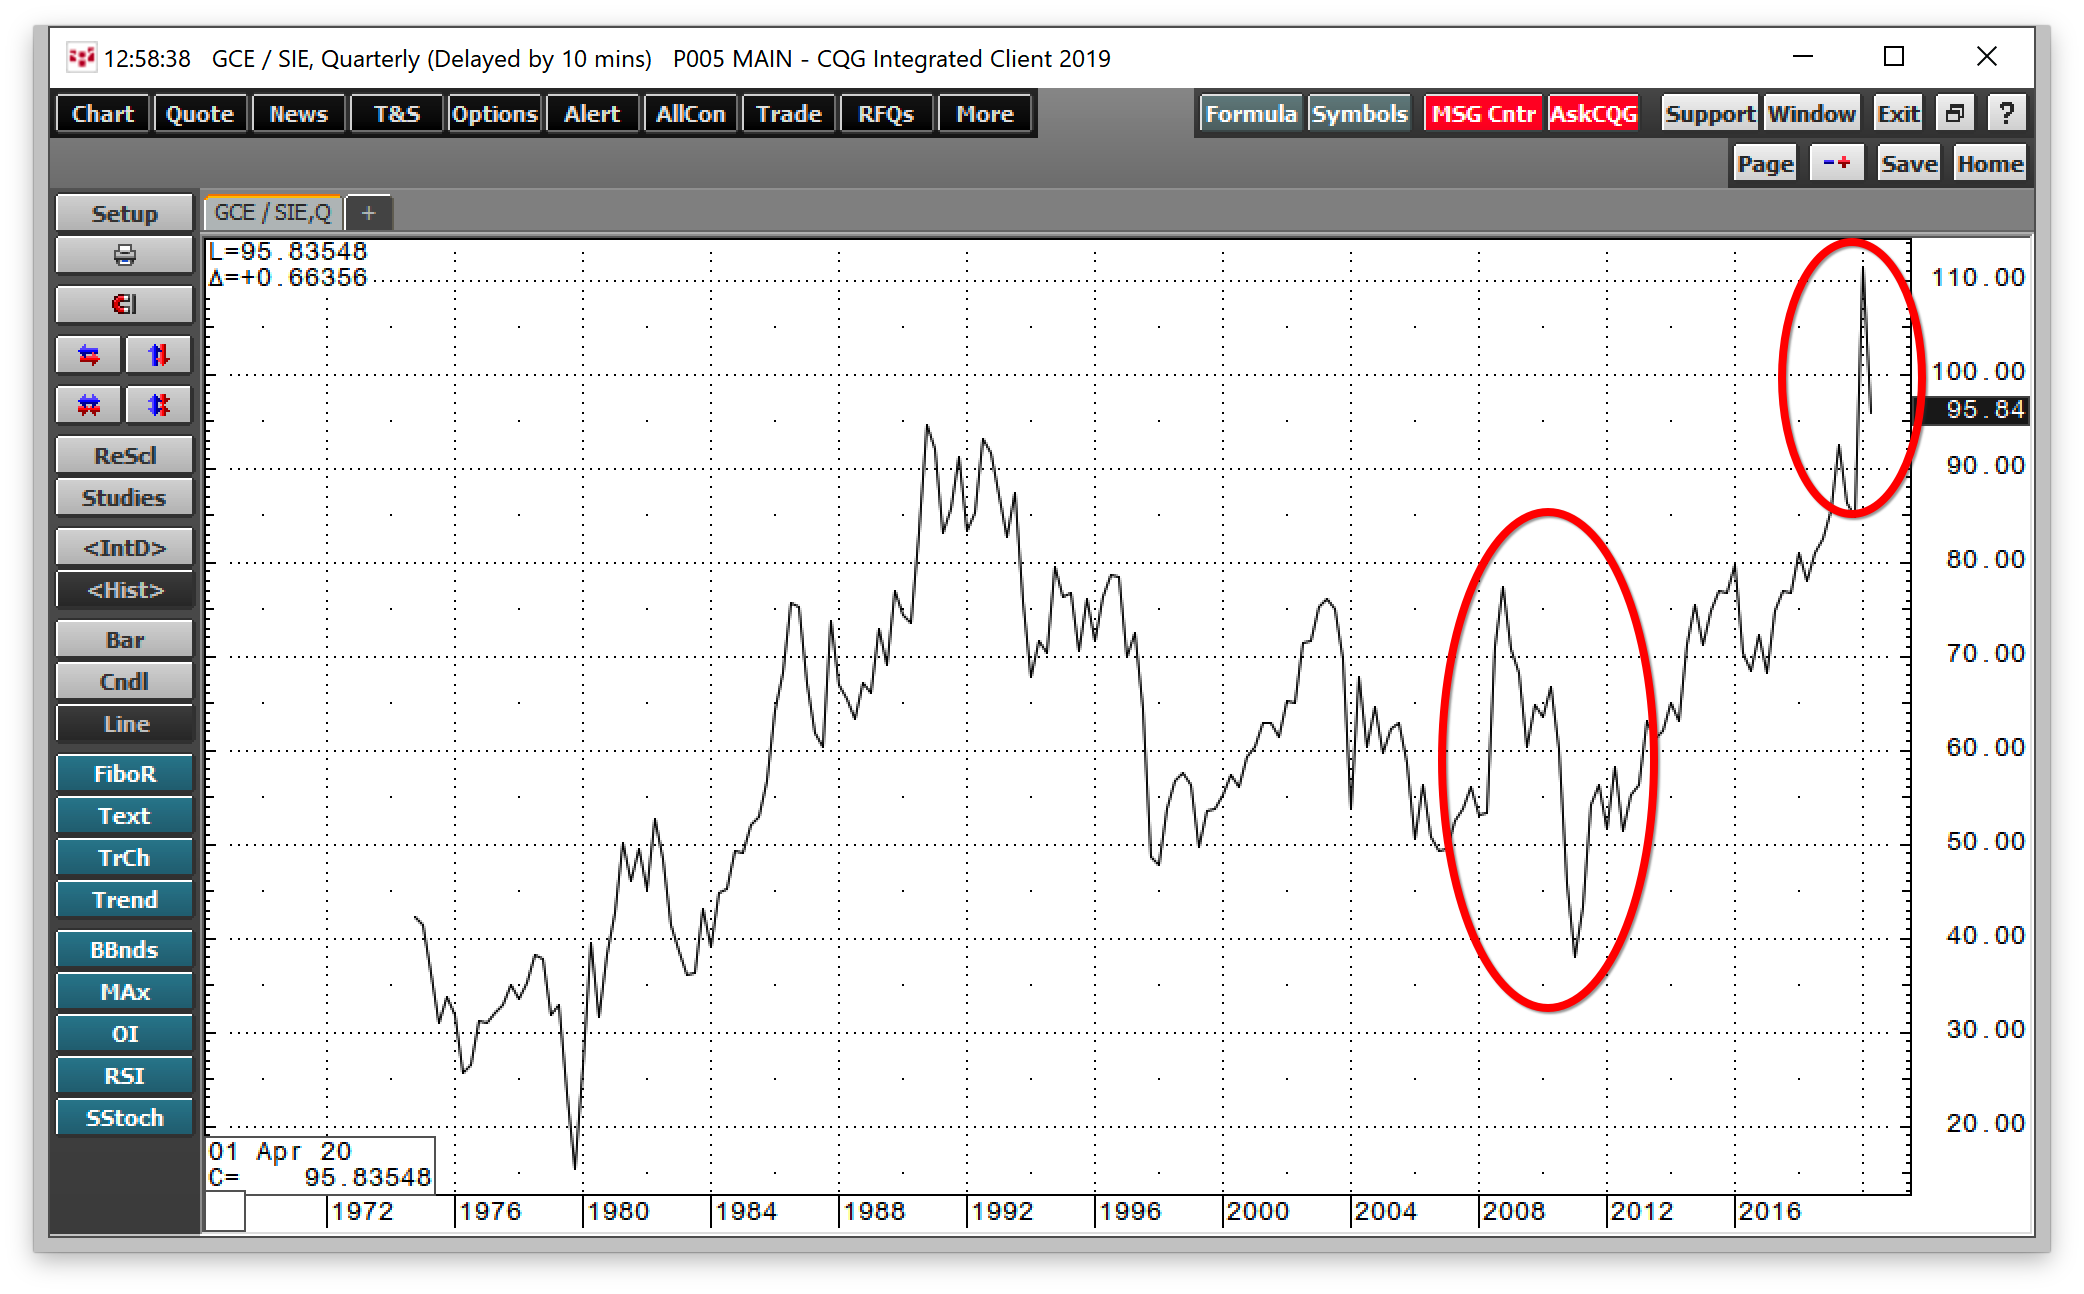
Indeed, the move in the ratio from 2008 through 2011 could be a model for the future.

The chart above shows that in 2008, the kneejerk reaction in the relationship was a move to a high of 77.37:1, then the highest level since 1996. Afterward, it fell to 38:1, the lowest since 1983.
Will government and Fed stimulus cause a similar move in the years ahead? The jury is still out, but the unprecedented level of liquidity in the global financial system is a compelling case that history will repeat.
