- While September hasn't been kind to stocks historically, the next three months generally more than make up for it
- History suggests this quarter consists of the best-performing months of the year
- As stocks take a hit, you can look to bet on Alphabet stock, currently undervalued
September has a track record of being a bit of a downer in the stock market historically, and the numbers back it up. When we look at the average daily returns of the S&P 500, it's clear that the latter half of September tends to bring some seasonal weakness.
And as we've seen in the past 10 trading sessions, those declines have played out exactly as expected. Seasonal Signals Favor Q4 Surge: 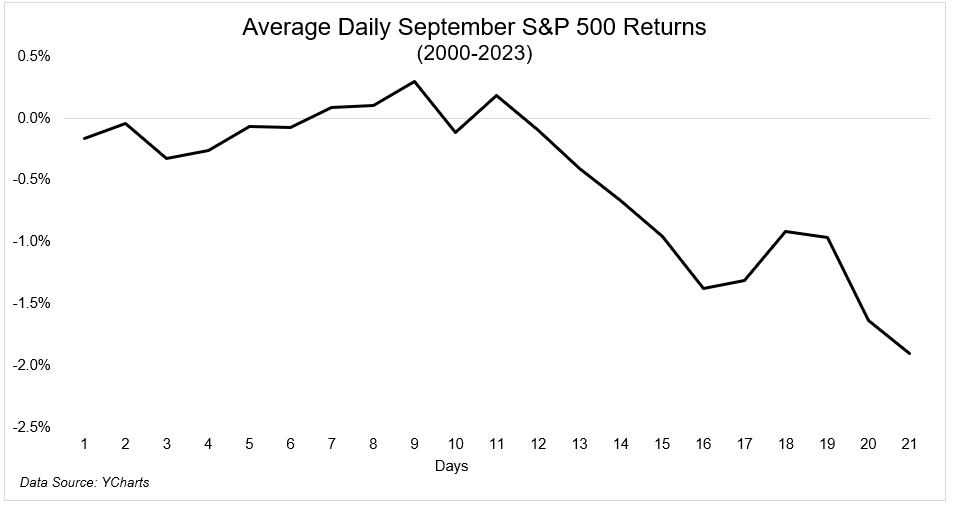
Source: YCharts
Sure, September might have thrown us some curveballs historically, but here's the good news: we're about to leave that disappointment behind and step into the three best-performing months of the year.
Let's take a quick look at what the last four years have brought us after September:
- 2020: -3.92%
- 2021: -4.76%
- 2022: -9.34%
- 2023: -5.00% (as of 28/9)
Now, let's talk about what's coming up in the next quarter (Q4):
- 2020: +11.69%
- 2021: +10.65%
- 2022: +7.08%
- 2023:?
So, the key takeaway here is to stay aware of the market's seasonality. It can help us avoid making hasty decisions, especially when we consider the expected historical returns for the next quarter. 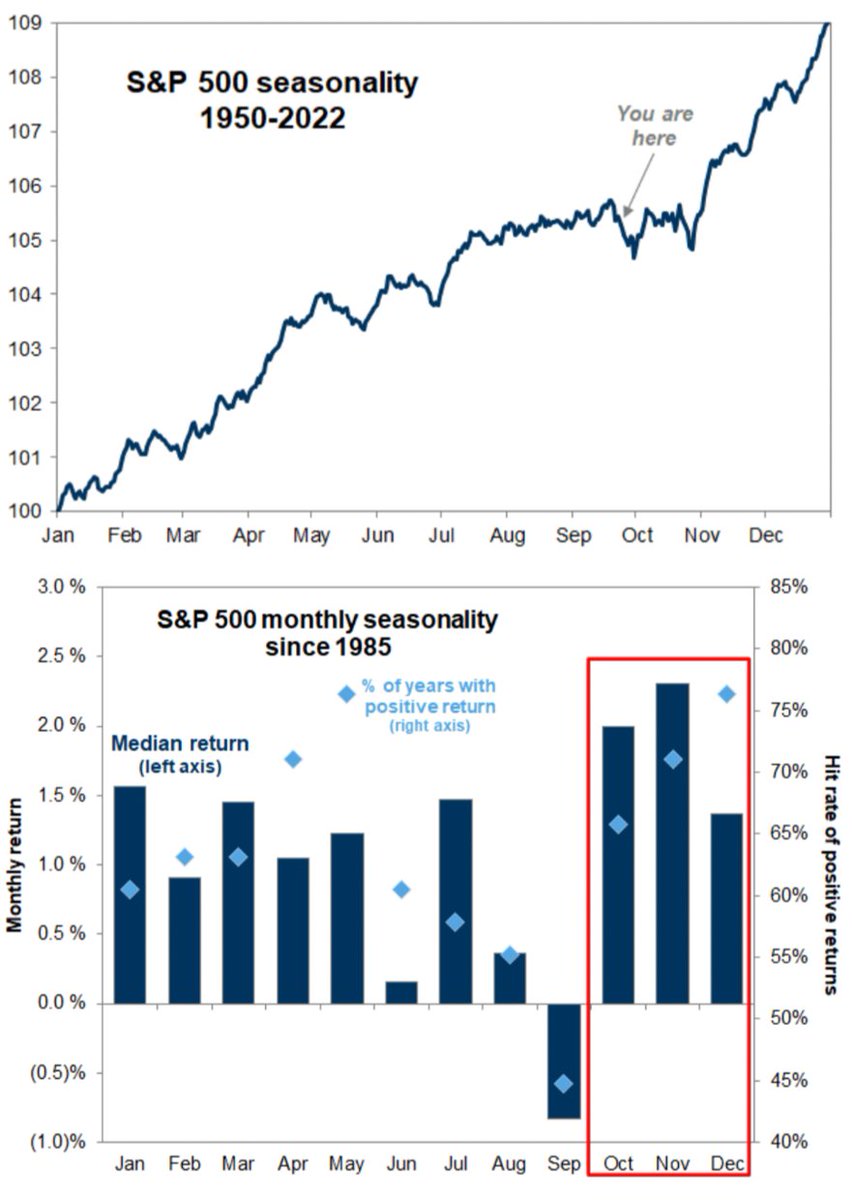
Right now, two charts are taking center stage: First, the US 10-year yield, which has reached its highest levels in 15 years. 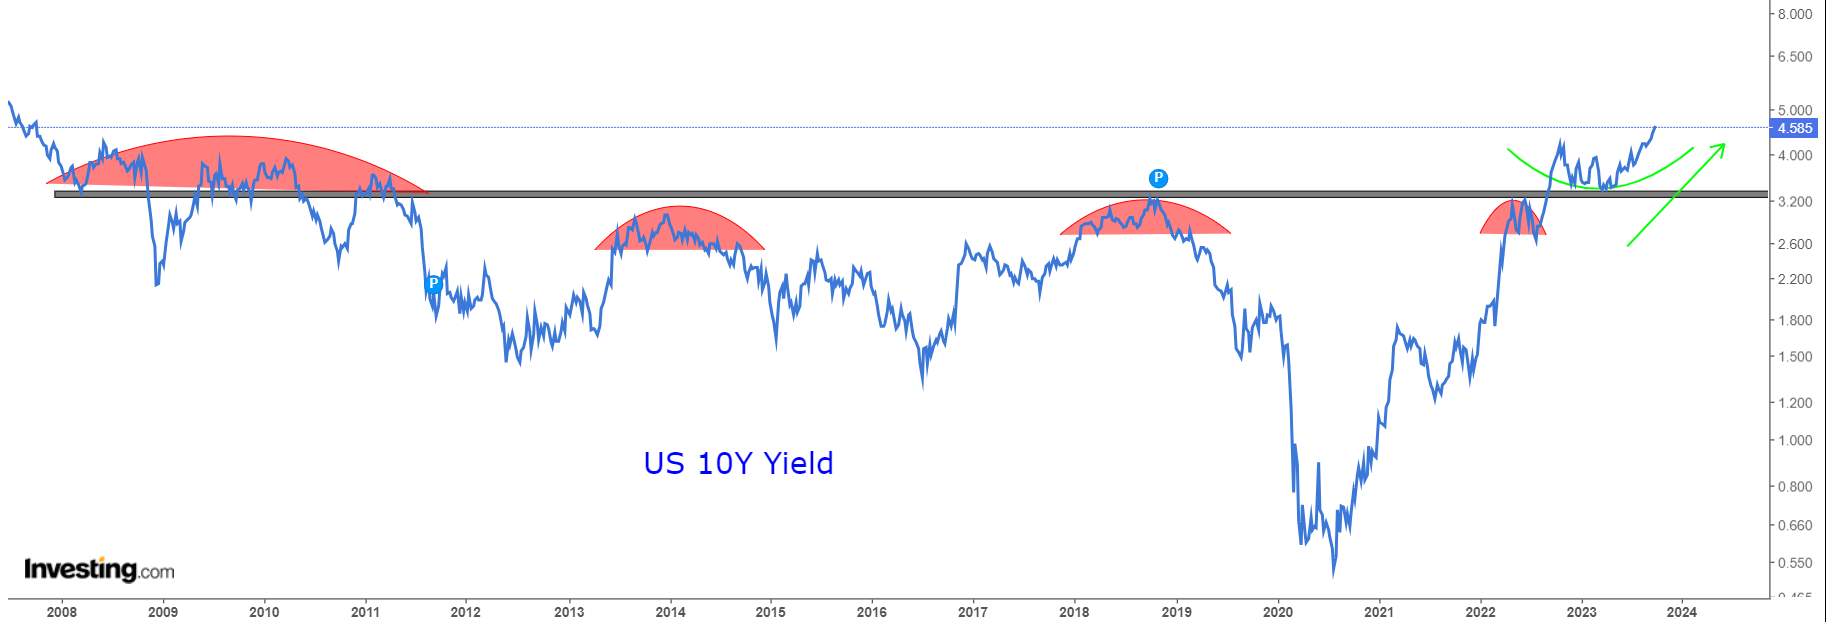
And oil prices, which are soaring to their highest points in 2023.

The big question that looms is whether these bullish trends will take a U-turn in the fourth quarter. Moreover, will the mega-caps continue to deliver outstanding performances? 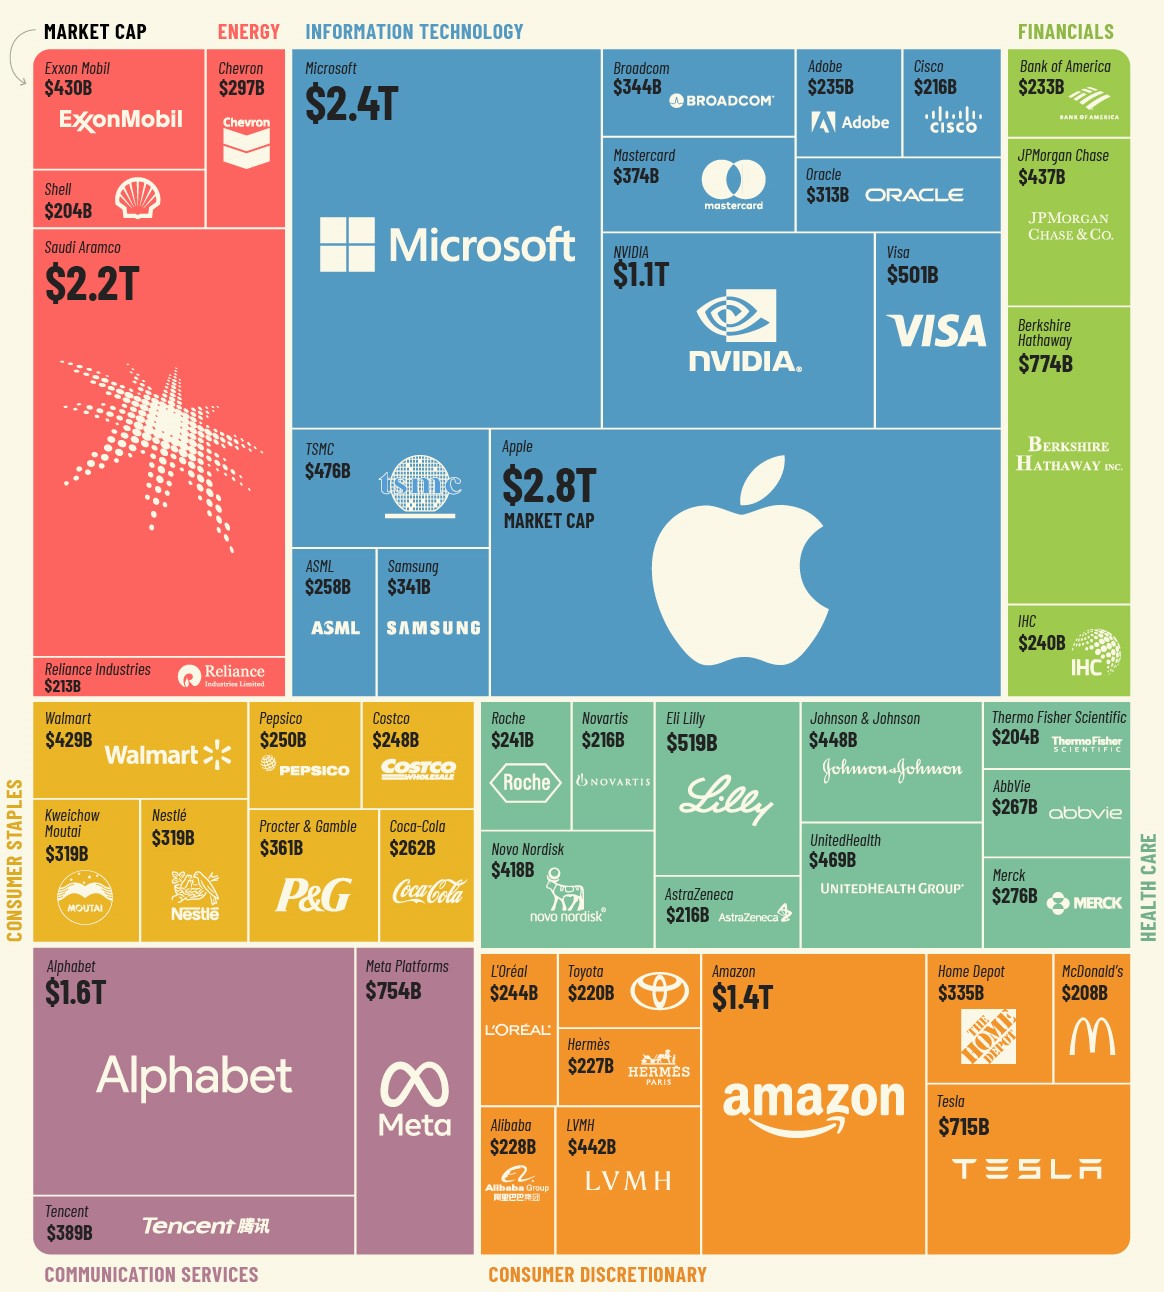
Source: Visual Capitalist
Which Mega-Cap Is Set to Outperform in Q4?
The 50 largest-value companies collectively hold a market capitalization exceeding $26.5 trillion. In terms of sectors, Information Technology (IT) boasts the highest representation among the top 50, with a combined market capitalization of $9.3 trillion.
It's worth noting that only a select few companies globally, including Apple (NASDAQ:AAPL), Microsoft Corporation (NASDAQ:MSFT), Saudi Aramco (TADAWUL:2222), Amazon.com (NASDAQ:AMZN), Alphabet C (NASDAQ:GOOG), and Nvidia (NASDAQ:NVDA), are part of the trillion-dollar club. Previously, Meta (NASDAQ:META) and Tesla (NASDAQ:TSLA) were members of this elite group as well.
Among these elite companies is Alphabet (NASDAQ:GOOGL), a corporation with an extensive presence in our daily lives through services like Google Search and Maps.
Its dominance is perhaps most evident in its Information Services Agreement, a two-decade-long arrangement through which Google pays substantial sums annually to maintain its position as the default search engine on Apple devices.
This extensive influence has led to antitrust scrutiny, with the U.S. Department of Justice initiating legal action due to perceived anticompetitive practices—a lawsuit of similar magnitude to the one brought against Microsoft in 2001.
The chart below illustrates Google's global dominance over other major search engines like Bing and Yahoo, with the exception of China and Russia.

Source: Similarweb
This advantage extends across all platforms, encompassing desktop, mobile, and tablet devices. Interestingly, despite Microsoft's substantial $10 billion investment in OpenAI in early 2023, resulting in the development of GPT-4, Bing maintains a notably low market share across various products and services.
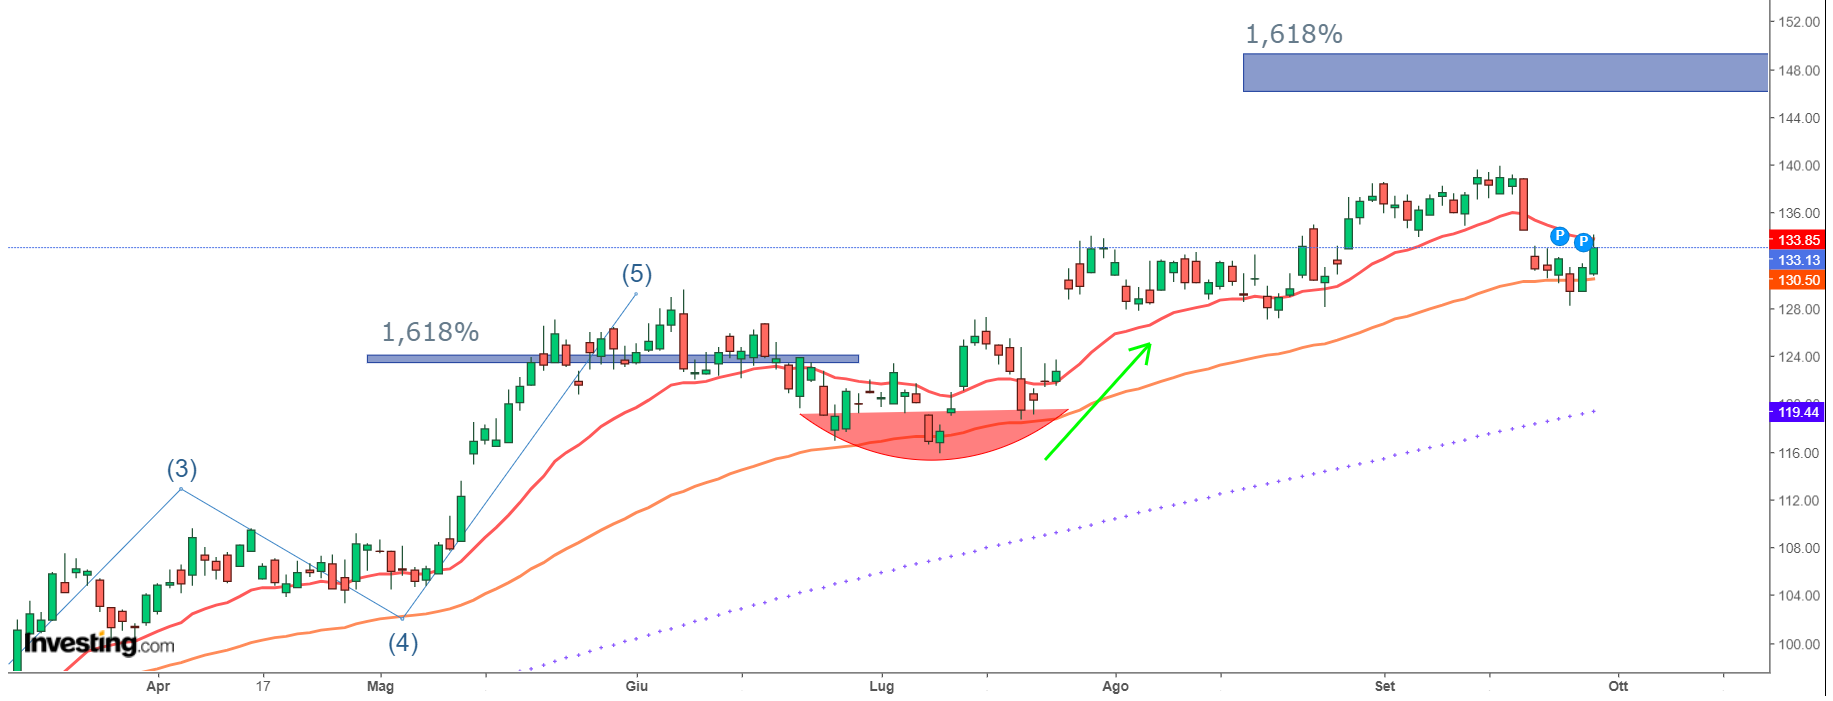
From a technical standpoint, Alphabet C has shown a robust upward trend since January 2023, serving as the origin of the 5 Elliott impulse waves that peaked in June 2023 at $127.9.
Following a correction in July 2023, the current price is in the process of forming the next 5 impulse waves.
By applying the Fibonacci relationship, we can probabilistically determine an upward target, with the SAR indicator parabola and the moving averages providing confirmation.
When analyzing Alphabet C using InvestingPro, it's evident that the stock is undervalued, and the Fair Value estimate aligns with the attention area highlighted in our previous analysis, which is at $149.33, with a potential upside of 11.8%.

Source: InvestingPro
Conclusion
The stock market is notoriously difficult to predict, and the fourth quarter is no exception.
However, based on historical trends and Alphabet's strong fundamentals, it is reasonable to believe that the stock could be a great bet if stocks rebound in Q4 and look to end 2023 on a high.
***

Disclaimer: This article is written for informational purposes only; it does not constitute a solicitation, offer, advice, counseling or recommendation to invest as such it is not intended to incentivize the purchase of assets in any way. I would like to remind you that any type of asset, is evaluated from multiple points of view and is highly risky and therefore, any investment decision and the associated risk remains with the investor.
