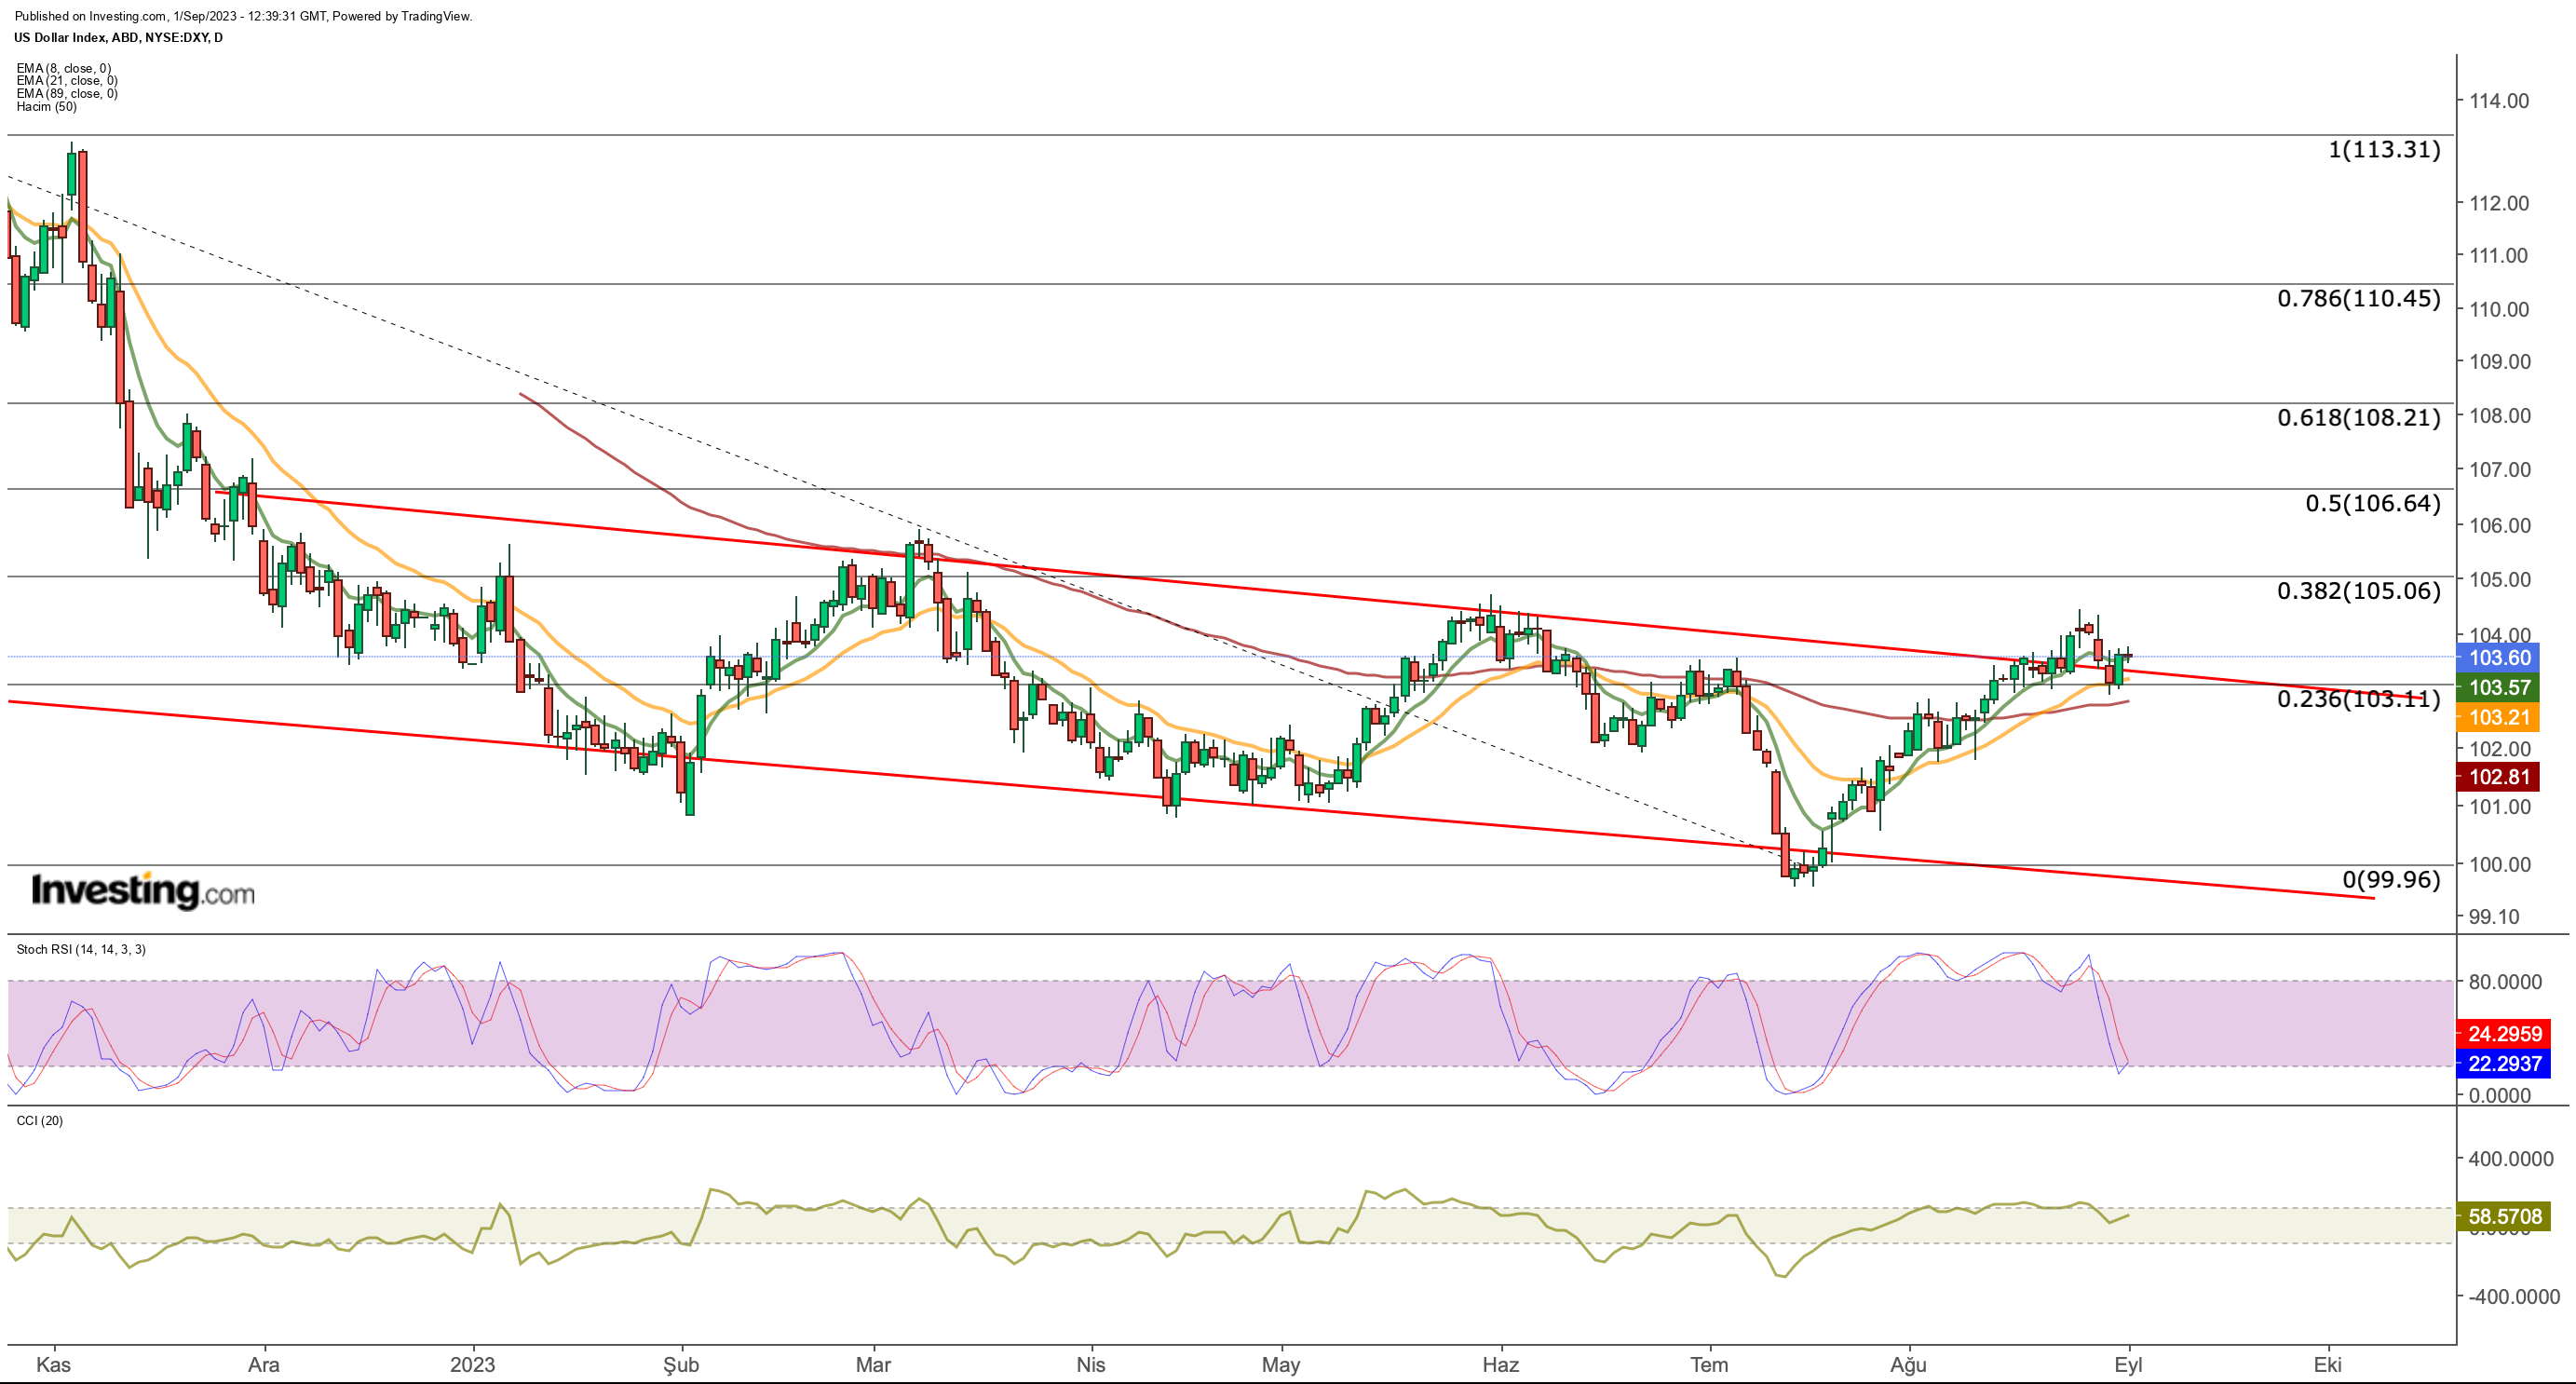
- The US Dollar appears poised to continue to move lower after latest economic data
- The euro, on the other hand, has been pricing in the possibility of further rather hikes from the ECB
- Meanwhile, XAU/USD tests support
This week witnessed notable fluctuations in the global Forex market, particularly with the release of data from both the US and the Eurozone.
In the midst of these developments, the US dollar displayed signs of short-term vulnerability vulnerability when compared to major global currencies. As a result, the greenback appear poised to turn lower after a remarkable six-week streak of gains. The index, which had held at 103.66, experienced a modest weekly decline of half a point and could potentially end this positive trend if it closes below 104.1.
That's mostly because throughout the week, US economic data hinted at a possible slowdown. Notably, both US Gross Domestic Product (GDP) and ADP NonFarm Payrolls figures fell short of expectations. Conversely, recent data releases showed personal consumption expenses aligning with projections while unemployment benefit applications remained below anticipated levels.
Shifting our focus to the Euro Area, core inflation remained consistent with forecasts, while the annual Consumer Price Index (CPI) exceeded expectations by 0.2 percent. This current situation in Europe has cast doubt on the likelihood of the European Central Bank (ECB) maintaining unchanged interest rates in September.
Now, let's delve into the technical aspects of the DXY movement in light of the latest developments.
Last week, the DXY broke out of a bearish horizontal channel with a closing value of 104 but seemed inclined to retest the upper boundary of this channel this week, exhibiting a mild easing. While there isn't yet concrete confirmation of an upward breakout for the DXY, reaching the 105 level assumes importance for validating the dollar's strength.
However, if the market prices in the likelihood of the US maintaining its interest rates in September, we might observe a continued decline in the DXY, reverting to the channel pattern. From a technical standpoint, the pivotal level to watch is at 103, which could determine the index's direction moving forward.
If the dollar tends to weaken in the coming days, the possibility of the DXY falling to the 100 level limit increases depending on the current channel movement. In the upside, we continue to follow the 105 limit as a breakout point. However, according to the current data, the possibility of a correction outweighs the upside.
What's Next for the EUR/USD?
the EUR/USD made a move to get back into the channel this week after breaching the lower band of the ascending channel last week and testing the 1.07 band. For the euro to strengthen, it needs to regain the $1.09 band, but the moves towards this area have been weak this week.
A possible increase in demand for the euro could be the catalyst for a reversal of the EUR/USD trend if the hawkish rhetoric regarding the ECB's rate hike in September continues. In the last case, it became important for EUR/USD to see a weekly close above 1.0860.
After a start above $1.086 next week, the resistance zone in the range of $1.09 - $1.096 will be closely monitored for trend reversal attempts. In the daily closes of the pair above 1.096, we may see the start of the last upward wave in the 2023 uptrend. This may trigger EUR/USD's movement towards the 1.13 - 1.14 range. In the lower region, the 1.08 level continues to be followed as the main support.
What's Next for the XAU/USD?
Ounce of gold tended to reverse the downward trend that has been continuing since May, with support in the $ 1,880 region in mid-August.
The recovery effort in XAU/USD, which continued this week after accelerating last week, has an image that breaks the short-term downtrend. The mixed course in the global economy may cause investors to see gold as a safe haven again. In this case, the average $ 1,970 region may be decisive for the continuation of the rise. In weekly closures above this value, we can see that ounce gold can step into the $ 2,000 region again. If the trend continues, we can see that the next record levels may occur in the range of $ 2,130 - $ 2,200.
In the lower region, short-term EMA values extending to $ 1,925 constitute a support zone for gold. XAU/USD, which will retreat to the negative zone below this value, may continue to depreciate towards the $ 1,800 region depending on the downtrend.
***
Disclosure: The authors holds no positions in any of the securities mentioned in this report.
