In this Mantle (MNT) price prediction 2024, 2025-2030, we will analyze the price patterns of MNT by using accurate trader-friendly technical analysis indicators and predict the future movement of the cryptocurrency.
Mantle (MNT) Current Market Status
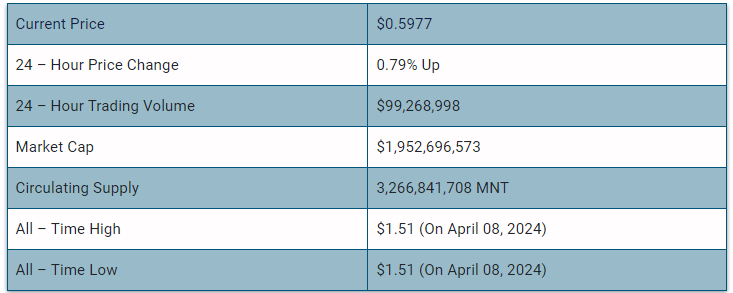
What is Mantle (MNT)

Mantle Network positions itself as a technology stack designed to enhance the scalability of Ethereum, emphasizing EVM (Ethereum Virtual Machine) compatibility. The commitment to EVM compatibility ensures seamless functionality for contracts and tools, requiring minimal adjustments for migration from Ethereum to Mantle Network. This compatibility enables users to explore a diverse range of web3 applications, while developers benefit from an efficient, low-fee environment for deploying smart contracts.
At its foundational level, Mantle Network adopts a modular architecture that integrates an optimistic roll-up protocol with an innovative data availability solution. This unique combination not only inherits the security features of Ethereum but also introduces cost-effectiveness and increased accessibility in terms of data availability. Mantle Network’s approach aims to contribute to the broader blockchain ecosystem by addressing scalability challenges while maintaining compatibility with the established Ethereum infrastructure.
Mantle 24H Technicals
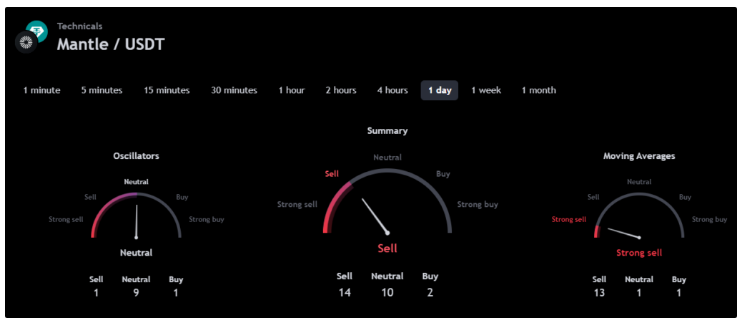
Mantle (MNT) Price Prediction 2024
Mantle (MNT) ranks 40th on CoinMarketCap in terms of its market capitalization. The overview of the Mantle price prediction for 2024 is explained below with a daily time frame.
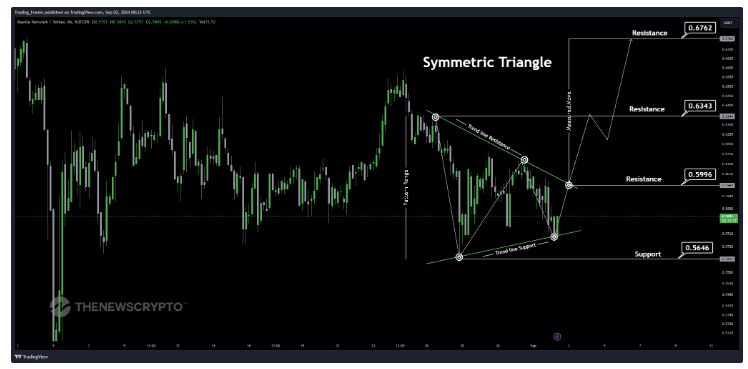
In the above chart, Mantle (MNT) laid out a Symmetric Triangle pattern. Symmetrical triangles form during price consolidation, characterized by two converging trend lines of similar slopes. This pattern typically precedes a breakout or breakdown, where breaking the lower trend line initiates a bearish trend while breaking the upper trend line indicates a bullish trend’s start. The breakout or breakdown targets are determined by measuring the distance between the pattern’s initial high and low, applied to the breakout or breakdown point.
At the time of analysis, the Mantle (MNT) price was $0.5843. If the pattern trend continues, then the price of MNT might reach the resistance level of $0.5996, $0.6343, and $1.6762. If the trend reverses, then the price of MNT may fall to the support of $0.5646.
Mantle (MNT) Resistance and Support Levels
The chart given below elucidates the possible resistance and support levels of Mantle (MNT) in 2024.
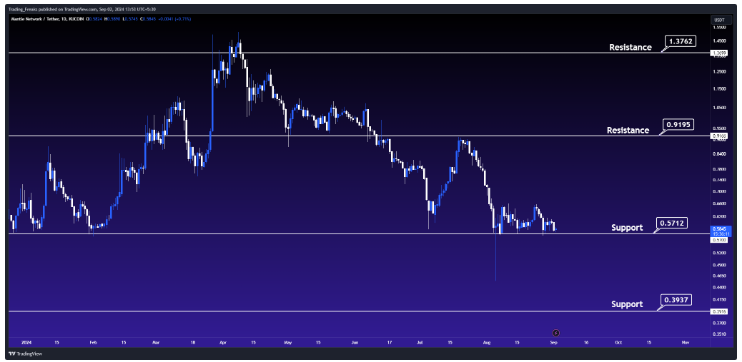
From the above chart, we can analyze and identify the following as resistance and support levels of Mantle (MNT) for 2024.

Mantle (MNT) Price Prediction 2024 — RVOL, MA, and RSI
The technical analysis indicators such as Relative Volume (RVOL), Moving Average (MA), and Relative Strength Index (RSI) of Mantle (MNT) are shown in the chart below.
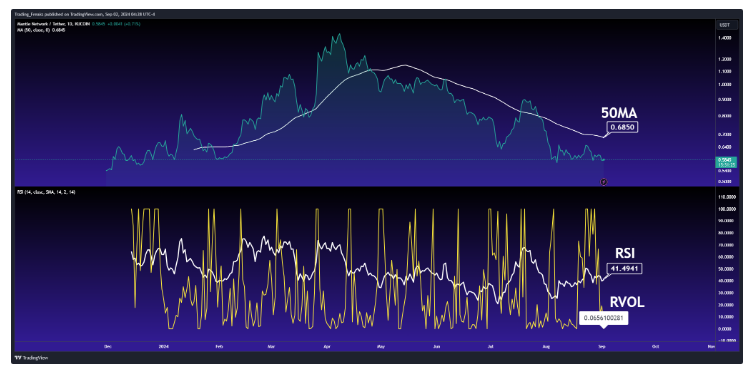
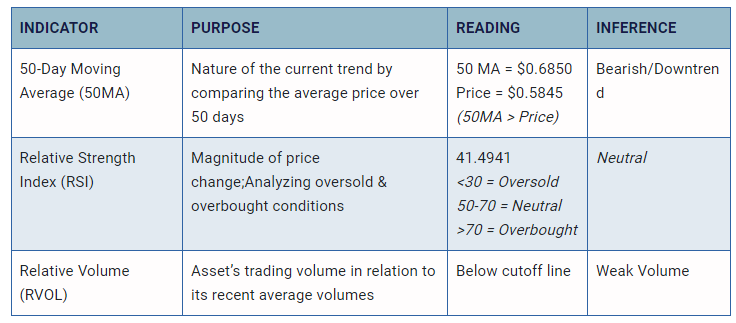
From the readings on the chart above, we can make the following inferences regarding the current Mantle (MNT) market in 2024.
Mantle (MNT) Price Prediction 2024 — ADX, RVI
In the below chart, we analyze the strength and volatility of Mantle (MNT) using the following technical analysis indicators — Average Directional Index (ADX) and Relative Volatility Index (RVI).
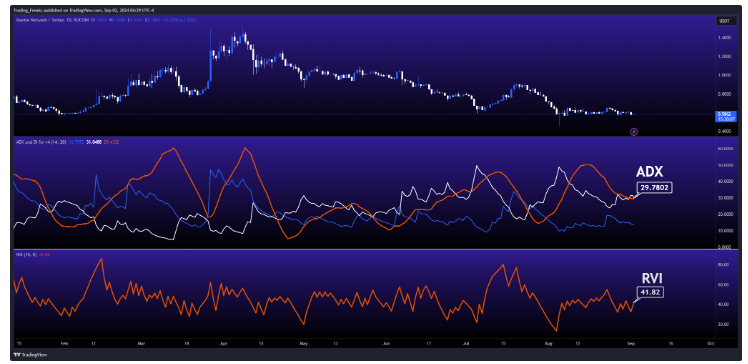
From the readings on the chart above, we can make the following inferences regarding the price momentum of Mantle (MNT).

Comparison of MNT with BTC, ETH
Let us now compare the price movements of Mantle (MNT) with that of Bitcoin (BTC), and Ethereum (ETH).
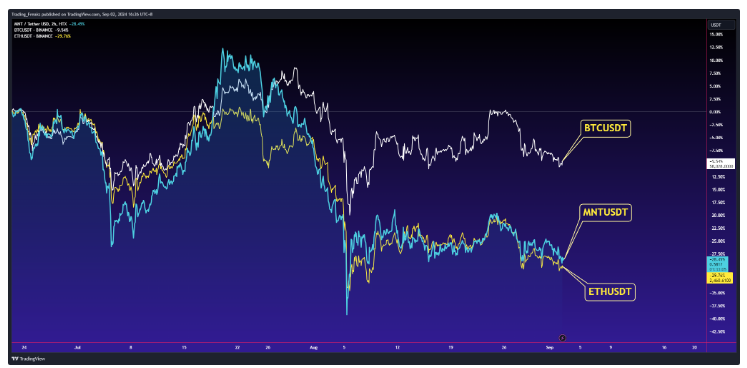
From the above chart, we can interpret that the price action of MNT is similar to that of BTC and ETH. That is, when the price of BTC and ETH increases or decreases, the price of MNT also increases or decreases respectively.
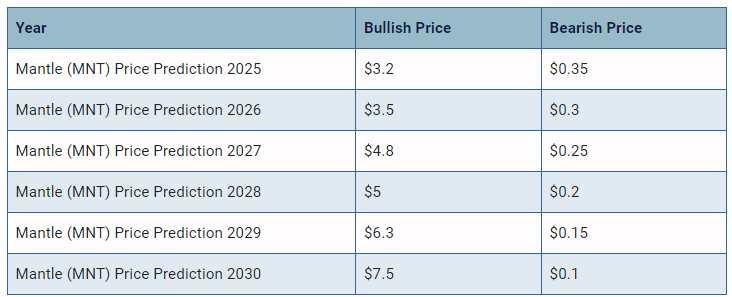
Mantle (MNT) Price Prediction 2025, 2026 – 2030
With the help of the aforementioned technical analysis indicators and trend patterns, let us predict the price of Mantle (MNT) between 2025, 2026, 2027, 2028, 2029 and 2030.
Conclusion
If Mantle (MNT) establishes itself as a good investment in 2024, this year would be favorable to cryptocurrency. In conclusion, the bullish Mantle (MNT) price prediction for 2024 is $1.3762. Comparatively, if unfavorable sentiment is triggered, the bearish Mantle (MNT) price prediction for 2024 is $0.3937.
If the market momentum and investors’ sentiment positively elevate, then Mantle (MNT) might hit $2.5. Furthermore, with future upgrades and advancements in the Mantle ecosystem, MNT might surpass its current all-time high (ATH) of $1.51 and mark its new ATH.
This content was originally published by our partners at The News Crypto.
