- Indexes seem to be running out of steam during a historically lackluster September
- The tech sector drove the S&P 500 index's rally over the last decade and still continues to do so
- So, have the tech titans become overvalued now, or can they still continue do drive the index's gains?
The market is following historical trends, which are often easy to overlook.
Major stock indexes reached their peak in July, and many individual stocks have hit new 52-week highs in recent months. However, this is actually quite typical for this time of year. In fact, if the markets were behaving differently, that would be considered unusual.
One aspect that might seem unusual is the dominance of large-cap stocks in 2023. Other good companies may have better valuations and fundamentals but continue to lag behind.
Here's a comparison of the performance between the S&P 500's market capitalization-weighted index and the equal-weight index:  Source: Investing.com
It is apparent that the mega-cap stocks played a pivotal role in driving the rally.
Now, many have different explanations for the performance gap between the top 10 stocks and the other 490 in the S&P 500 index.
To illustrate this, take a look at the cash flows into ETFs, which have been disproportionately directed toward larger capitalization stocks. Out of approximately 1,500 ETFs, the top 10 stocks in the S&P 500 are present in more than 25% of all ETFs issued.
Here's Investing Pro's Fair Value estimated upside/downside for the top 10 stocks in the S&P 500 year-to-date:
- Apple (NASDAQ:AAPL) $165.2 (-7.3%)
- Microsoft (NASDAQ:MSFT) $332.4 (-0.5%)
- Amazon (NASDAQ:AMZN) $152.6 (+10.2%)
- Nvidia (NASDAQ:NVDA) $379 (-16.8%)
- Alphabet (NASDAQ:GOOGL) A $150.8 (+10.6%)
- Tesla (NASDAQ:TSLA) $256.8 (+3.3%)
- Meta (NASDAQ:META) $350.2 (+17.8%)
- Alphabet C (NASDAQ:GOOG) $151.4 (+10%)
- Berkshire Hathaway (NYSE:BRKa) $726,013 (+31%)
- UnitedHealth (NYSE:UNH) $579 (+20.5%)
Meanwhile, Goldman Sachs has once again lowered the 12-month recession probability to 15%, down from 35% in March.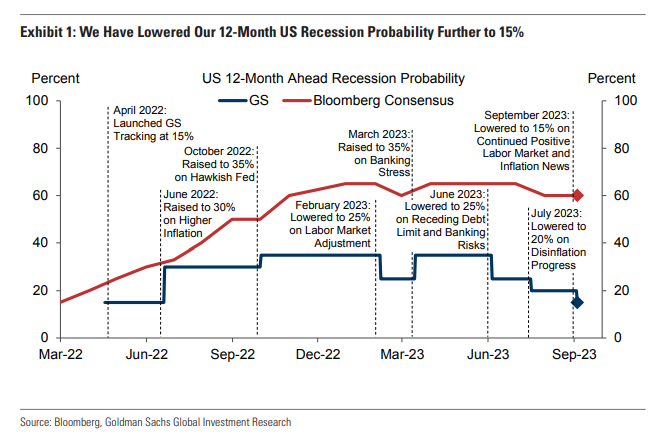
Source: Bloomberg, Goldman Sachs
The chart also shows that the Bloomberg Consensus still remains relatively high, nearing 60%. This could be influenced by factors such as the seasonality of the VIX.
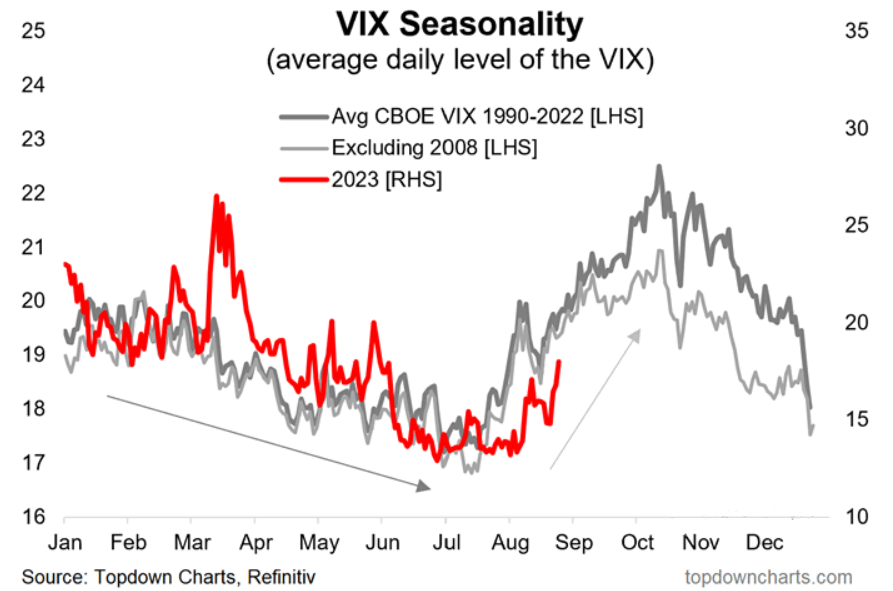
Source: Topdown Charts, Refinitiv
The coming months may naturally see the VIX move higher as uncertainty grows. However, one thing remains nearly certain: over the past decade, the tech sector has consistently driven stock market performance.
When it comes to the presence of these companies in various ETFs, the simplest explanation could be that these top tech companies are, in fact, some of the best companies in the world.
Since 2015, big tech companies have outperformed other stocks in the S&P 500 in terms of profits, with an average annual outperformance of 12.5%.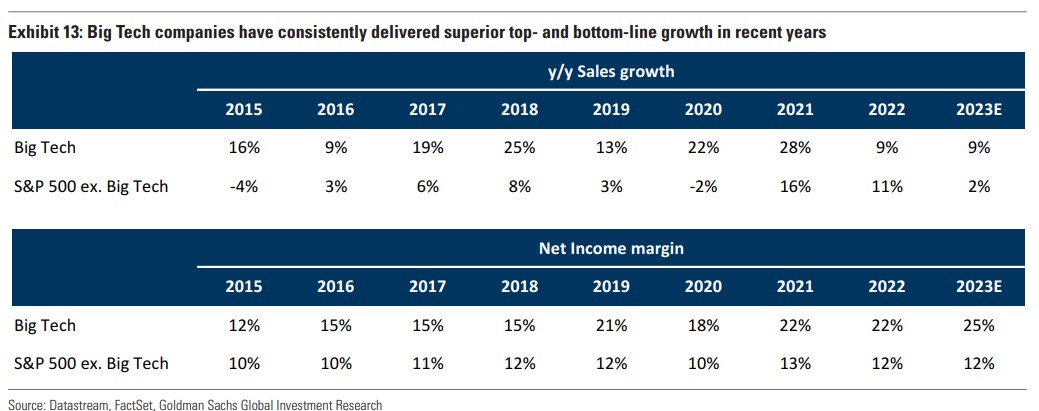 Source: Datastream, FactSet, Goldman Sachs
Investors wonder whether the current tech boom will end badly. Goldman Sachs conducted a study comparing today's big tech companies with those of the dot-com bubble, and the findings suggest that today's tech giants are not as expensive when looking at metrics like the 2-year price-to-earnings (P/E) ratio and enterprise value (E/V) ratio. In fact, during the dot-com bubble, these metrics were twice as high as they are today.
The key difference is that today's tech companies are larger and more diversified, operating in multiple sectors. They are also more profitable, with higher returns on capital and margins compared to those in 2000. The outperformance of tech stocks relative to other sectors is evident in the data.
This suggests that while there may be concerns about a tech bubble, the fundamentals of today's tech giants are stronger and more sustainable than those of the dot-com era. However, as with any investment, there are always risks to consider, and market dynamics can change.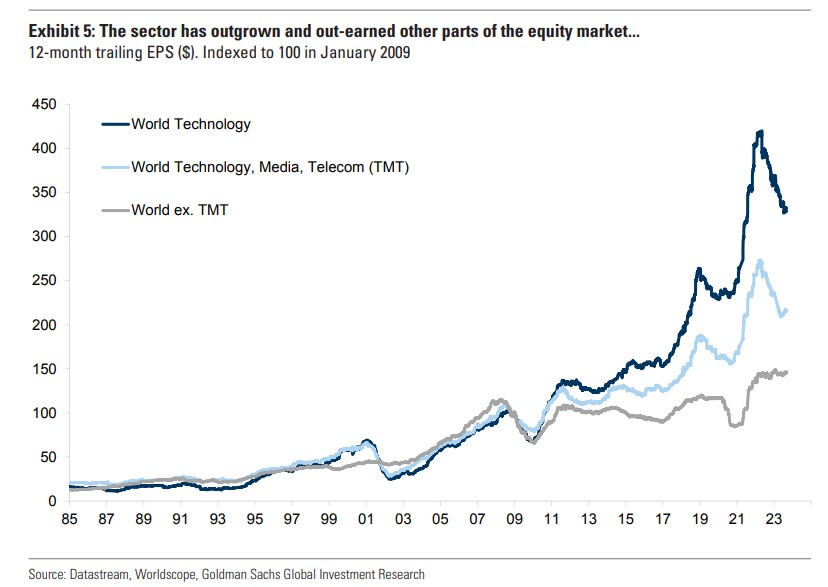
Source: Datastream, Goldman Sachs, Global Investment Research
From a technical standpoint, one notable metric is the percentage of stocks trading above the 200-day moving average within the S&P 500 index. 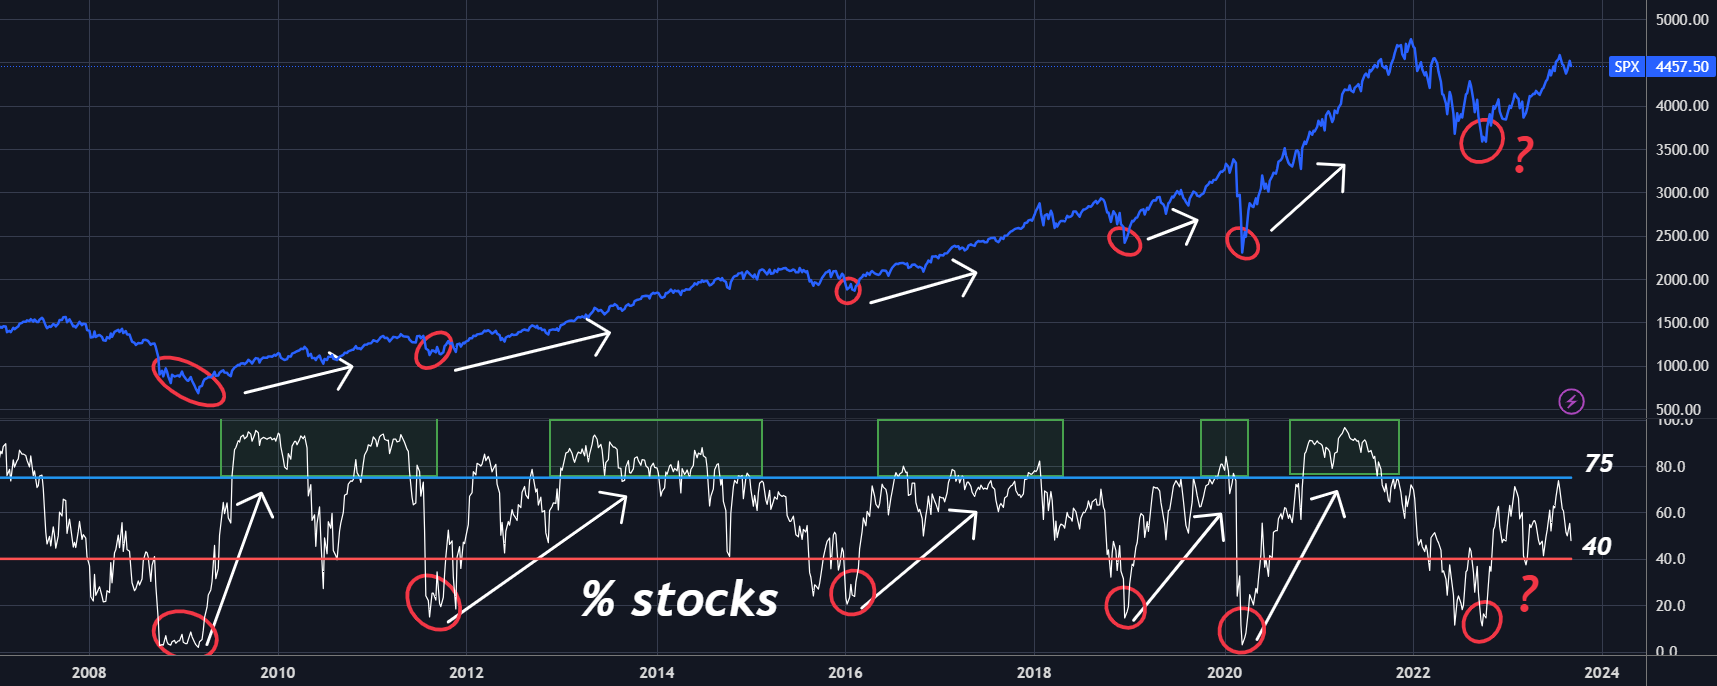
This indicator plays a crucial role in truly understanding who is leading the market rally. Currently, it reveals that only 50 percent of stocks are following an upward trend. For some, this might raise concerns about the potential for a continued upward trajectory, especially when compared to past periods.
Looking back at previous market lows, such as in 2008, 2011, 2016, 2018, and 2020, we observed that the percentage of stocks trading above the 200-day moving average exceeded the 75 percent threshold. However, in recent months, we have come close but haven't crossed this threshold, reaching only 73 percent.
If we were to consider only this data as the primary indicator, we might conclude that the current trend, which has seen gains of over 20% since the October 2022 lows, has not yet concluded. However, it's important to note that if the percentage falls below the 40% threshold, it could signal increased volatility and further declines.
It's crucial to emphasize that relying solely on this indicator is not advisable. Instead, it should be used in conjunction with other indicators and moving averages to gain a comprehensive view of market conditions and inform our investment strategies.
***
Disclaimer: This article is written for informational purposes only; it does not constitute a solicitation, offer, advice, or recommendation to invest as such it is not intended to incentivize the purchase of assets in any way. I would like to remind you that any type of asset, is evaluated from multiple points of view and is highly risky and therefore, any investment decision and the associated risk remains with the investor.

