- Gold is on the verge of hitting new historic highs.
- A weaker US dollar and rising geopolitical tensions bolster the bullish case.
- Focus is now on upcoming CPI data, that could spark the next move.
- For less than $8 a month, InvestingPro's Fair Value tool helps you find which stocks to hold and which to dump at the click of a button.
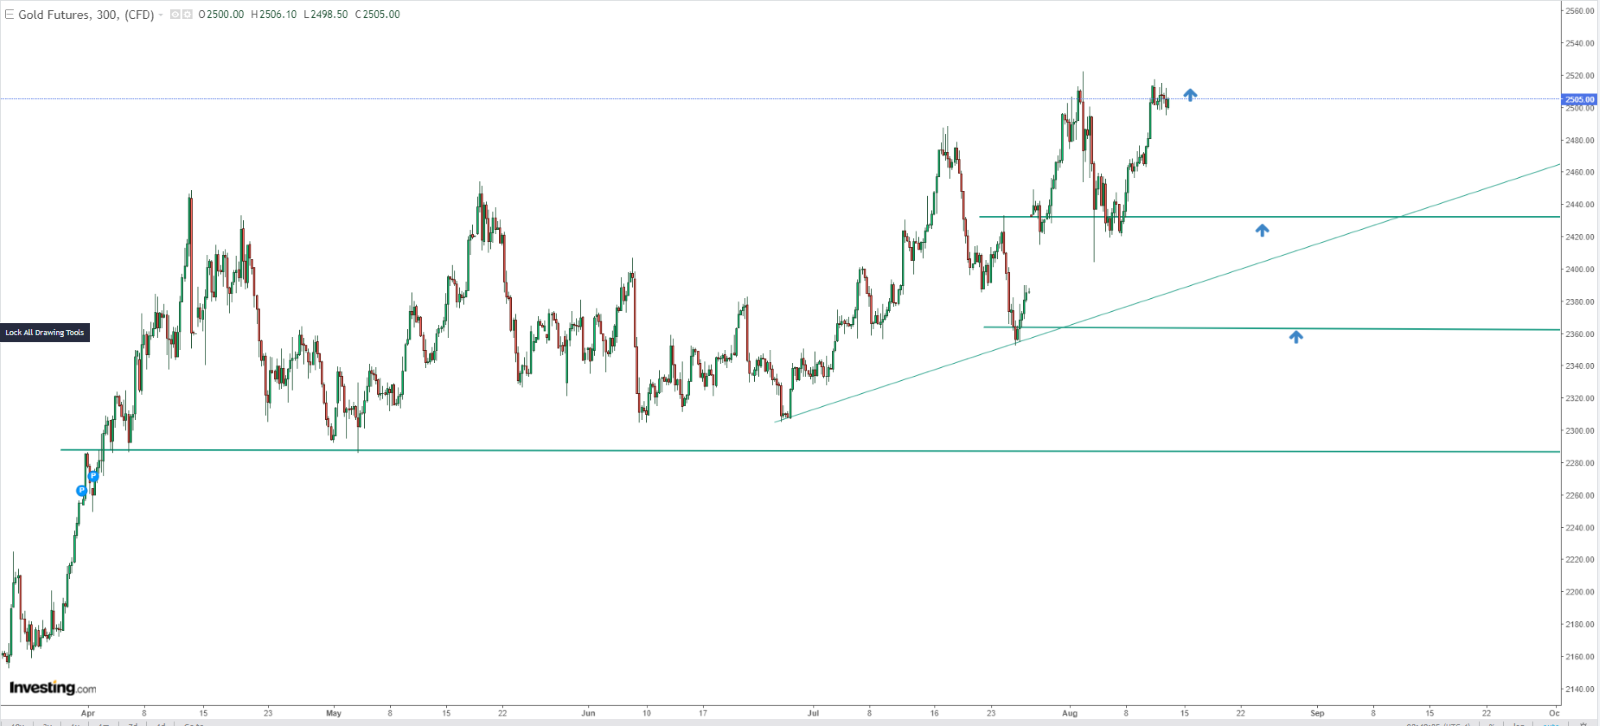
Gold, buoyed by recent gains, is once again targeting the historical peak of $2,520 per ounce. The current momentum strongly favors bulls, who are positioned to drive prices higher and sustain the long-term uptrend.
Several factors support this bullish outlook:
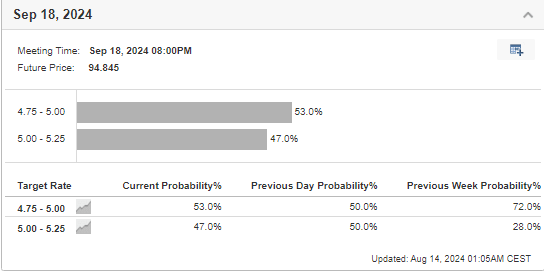
- A weaker US dollar as markets anticipate potential interest rate cuts by the Federal Reserve in September with expectations of a reduction of up to 50 basis points.
- The looming threat of an escalation in the Israel-Iran conflict could further boost safe-haven demand.
- Significant inflows into gold ETFs, with July's investments reaching $3.7 billion—the highest since April 2022. These funds now manage approximately $246 billion in total assets.
With these conditions in play, gold remains poised to continue its ascent.
US Inflation Data Key for Yellow Metal
Gold prices are rising as interest rates and bond yields decline. As it is a non-yielding asset, gold benefits from lower rates, supporting sustained demand and maintaining its long-term uptrend.
The market currently expects either a 25 or 50 basis point cut by the Federal Reserve next month, making today's inflation data crucial.

Regardless of the Fed's actions, gold’s long-term outlook remains bullish, with prices potentially targeting $3,000 per ounce. A significant rebound in CPI could alter this forecast, but such a scenario appears unlikely.
Geopolitical Tensions Are Escalating
The Middle East is on edge following a series of attacks by Hamas militants in Israel on October 7 last year. The ongoing conflict between Palestine and Israel has intensified, especially after the recent assassination of Hamas leader Ismail Haniyeh in Tehran.
If Iran's threats materialize, retaliatory actions could follow, increasing regional instability. Investors typically flock to gold during such volatile times, seeking safety amid escalating tensions.
Gold Eyes All-Time High
Gold prices have surged recently, driven by strong demand. Currently, buyers are testing resistance just above the $2,500 per ounce level.

If gold breaks through this resistance, the next key target will be the psychological barrier of $2,600. Should prices experience a rebound, the demand zone between $2,400 and $2,430 will likely become the focus for any potential correction.
In the early part of the day, markets may consolidate in anticipation of crucial inflation data.
***
This summer, get exclusive discounts on our subscriptions, including annual plans for less than $8 a month.
Try InvestingPro today and take your investing game to the next level.
Disclaimer: This article is written for informational purposes only; it does not constitute a solicitation, offer, advice, counsel or recommendation to invest as such it is not intended to incentivize the purchase of assets in any way. I would like to remind you that any type of asset, is evaluated from multiple perspectives and is highly risky and therefore, any investment decision and the associated risk remains with the investor.

