- The start of the holiday season brought a sideways trend for gold.
- This comes at a time when central banks continue to maintain positive reserve growth for the precious metal.
- With key technical support holding firm, is the correction about to end?
- Unlock AI-powered Stock Picks for Under $7/Month: Summer Sale Starts Now!
The summer doldrums have hit gold and silver, leaving them stuck in a sideways trading range. Even recent economic data, largely in line with expectations, hasn't spurred a breakout.
The Federal Reserve remains in a wait-and-see mode, keeping the market guessing on potential interest rate cuts with a 60% probability of a rate cut in September.
Investors are looking ahead to Friday's US labor market data for a sign of where the market might head next.
Central Banks Remain Bullish on Gold
Central banks have continued to be major buyers of physical gold, providing a strong pillar of demand for several years. In May, central banks purchased a net 10 tons of gold, with Poland emerging as the leader by acquiring 10 tons.
The National Bank of Poland has been actively buying gold for many months and ranked second globally for gold purchases in 2023. President Adam Glapinski has indicated that these purchases will continue. Other significant buyers in May included Turkey with 6 tons, India with 4 tons, and the Czech Republic with 3 tons.
China, however, took a break in its 18-month cycle of gold purchases, leaving it unclear whether this pause is temporary or marks the end of the buying spree. The medium- and long-term demand from central banks will be crucial for sustaining the current upward trend in gold prices.
Technical View: Gold Eyes Breakout
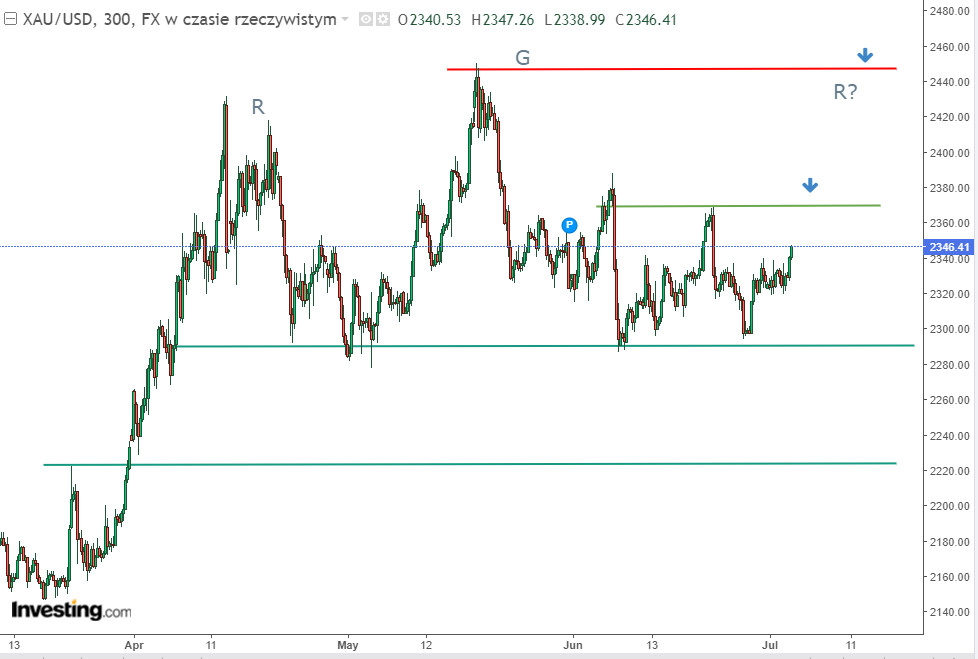
Despite the current lull, the outlook for gold remains positive. Last week, gold successfully defended its key support level at $2290 per ounce, a positive sign for the continuation of the uptrend.
The next hurdle for bulls is the $2380 resistance level, which also represents the upper limit of the recent consolidation. A breakout above this point could trigger further upward momentum.

If buyers succeed in this move, it could pave the way for a run at the recent high of $2,450. The potential for an inverse head and shoulders formation remains, with the neckline based on the key support level of around $2,290.
Silver's Bullish Signal
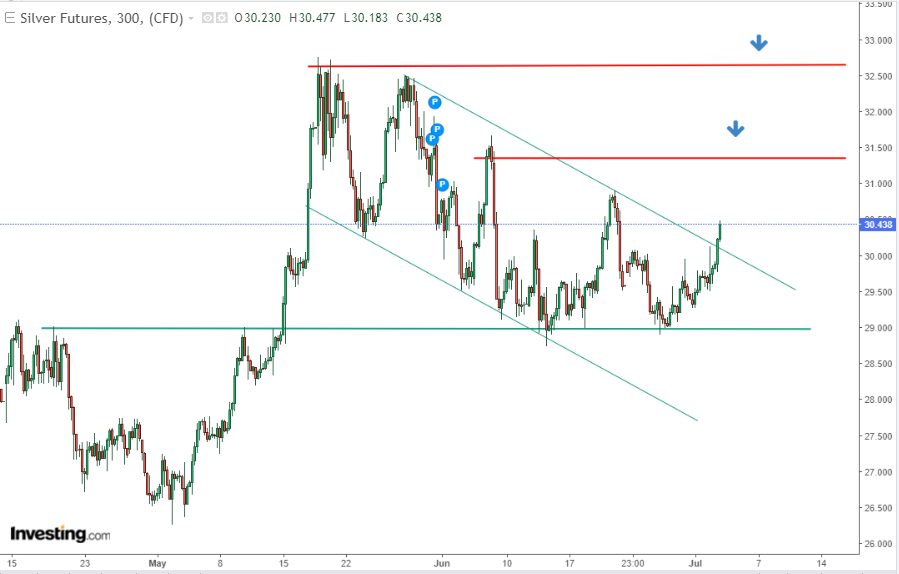
Silver is mirroring gold's strength, with bulls successfully defending the crucial $29 per ounce support level. Today's surge is even brighter news, as it breaks above the resistance line of a price channel, generating a bullish continuation signal.

This momentum bodes well for buyers. If it continues, they have ample room to push prices higher. Their immediate target is a clear supply zone around $31.50 per ounce. But the bullish story might not end there. In the medium and long term, silver still has the potential to challenge and potentially surpass its historical highs.
***
This summer, get exclusive discounts on our subscriptions, including annual plans for less than $7 a month!
Tired of watching the big players rake in profits while you're left on the sidelines?
InvestingPro's revolutionary AI tool, ProPicks, puts the power of Wall Street's secret weapon - AI-powered stock selection - at YOUR fingertips!
Don't miss this limited-time offer.
Subscribe to InvestingPro today and take your investing game to the next level!
Disclaimer: This article is written for informational purposes only; it does not constitute a solicitation, offer, advice, counsel or recommendation to invest as such it is not intended to incentivize the purchase of assets in any way. I would like to remind you that any type of asset, is evaluated from multiple perspectives and is highly risky and therefore, any investment decision and the associated risk remains with the investor.

