- Bitcoin's surge above $52,000 has contributed to the broader crypto market's renewed bullish momentum.
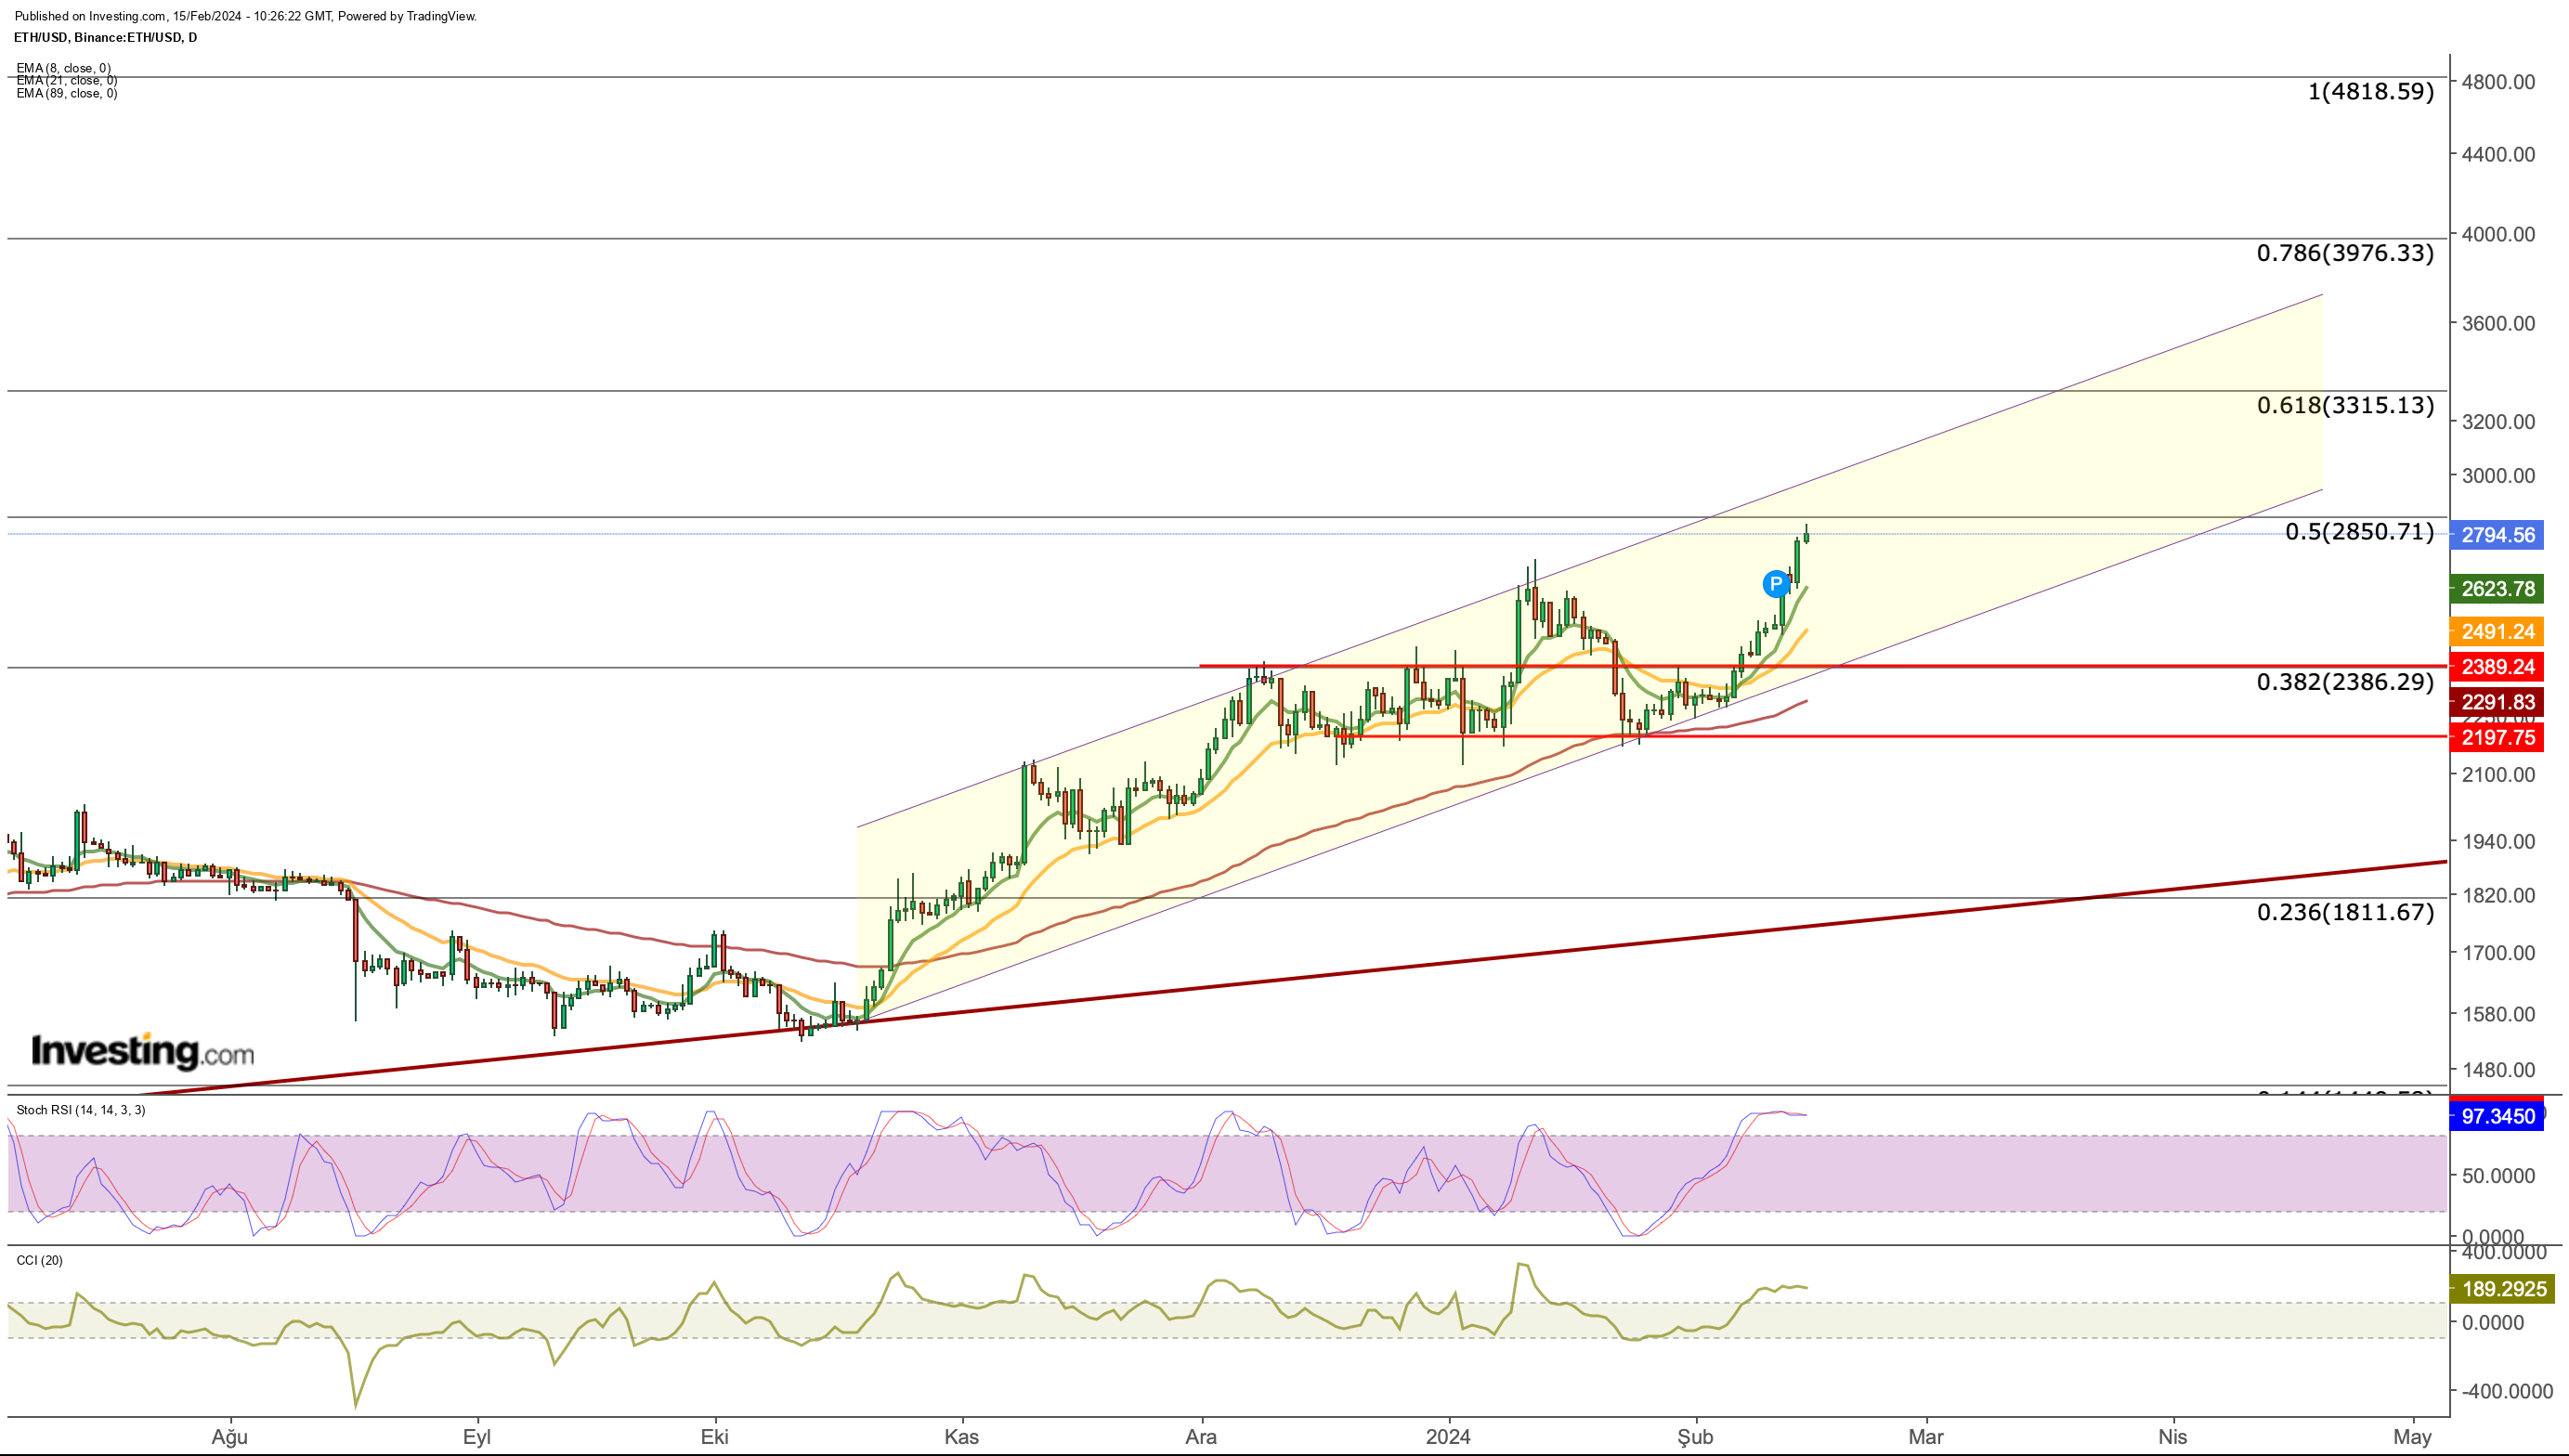
- Ethereum has recently gained bullish momentum, breaking out from a sideways phase and approaching a critical resistance level at $2,850.
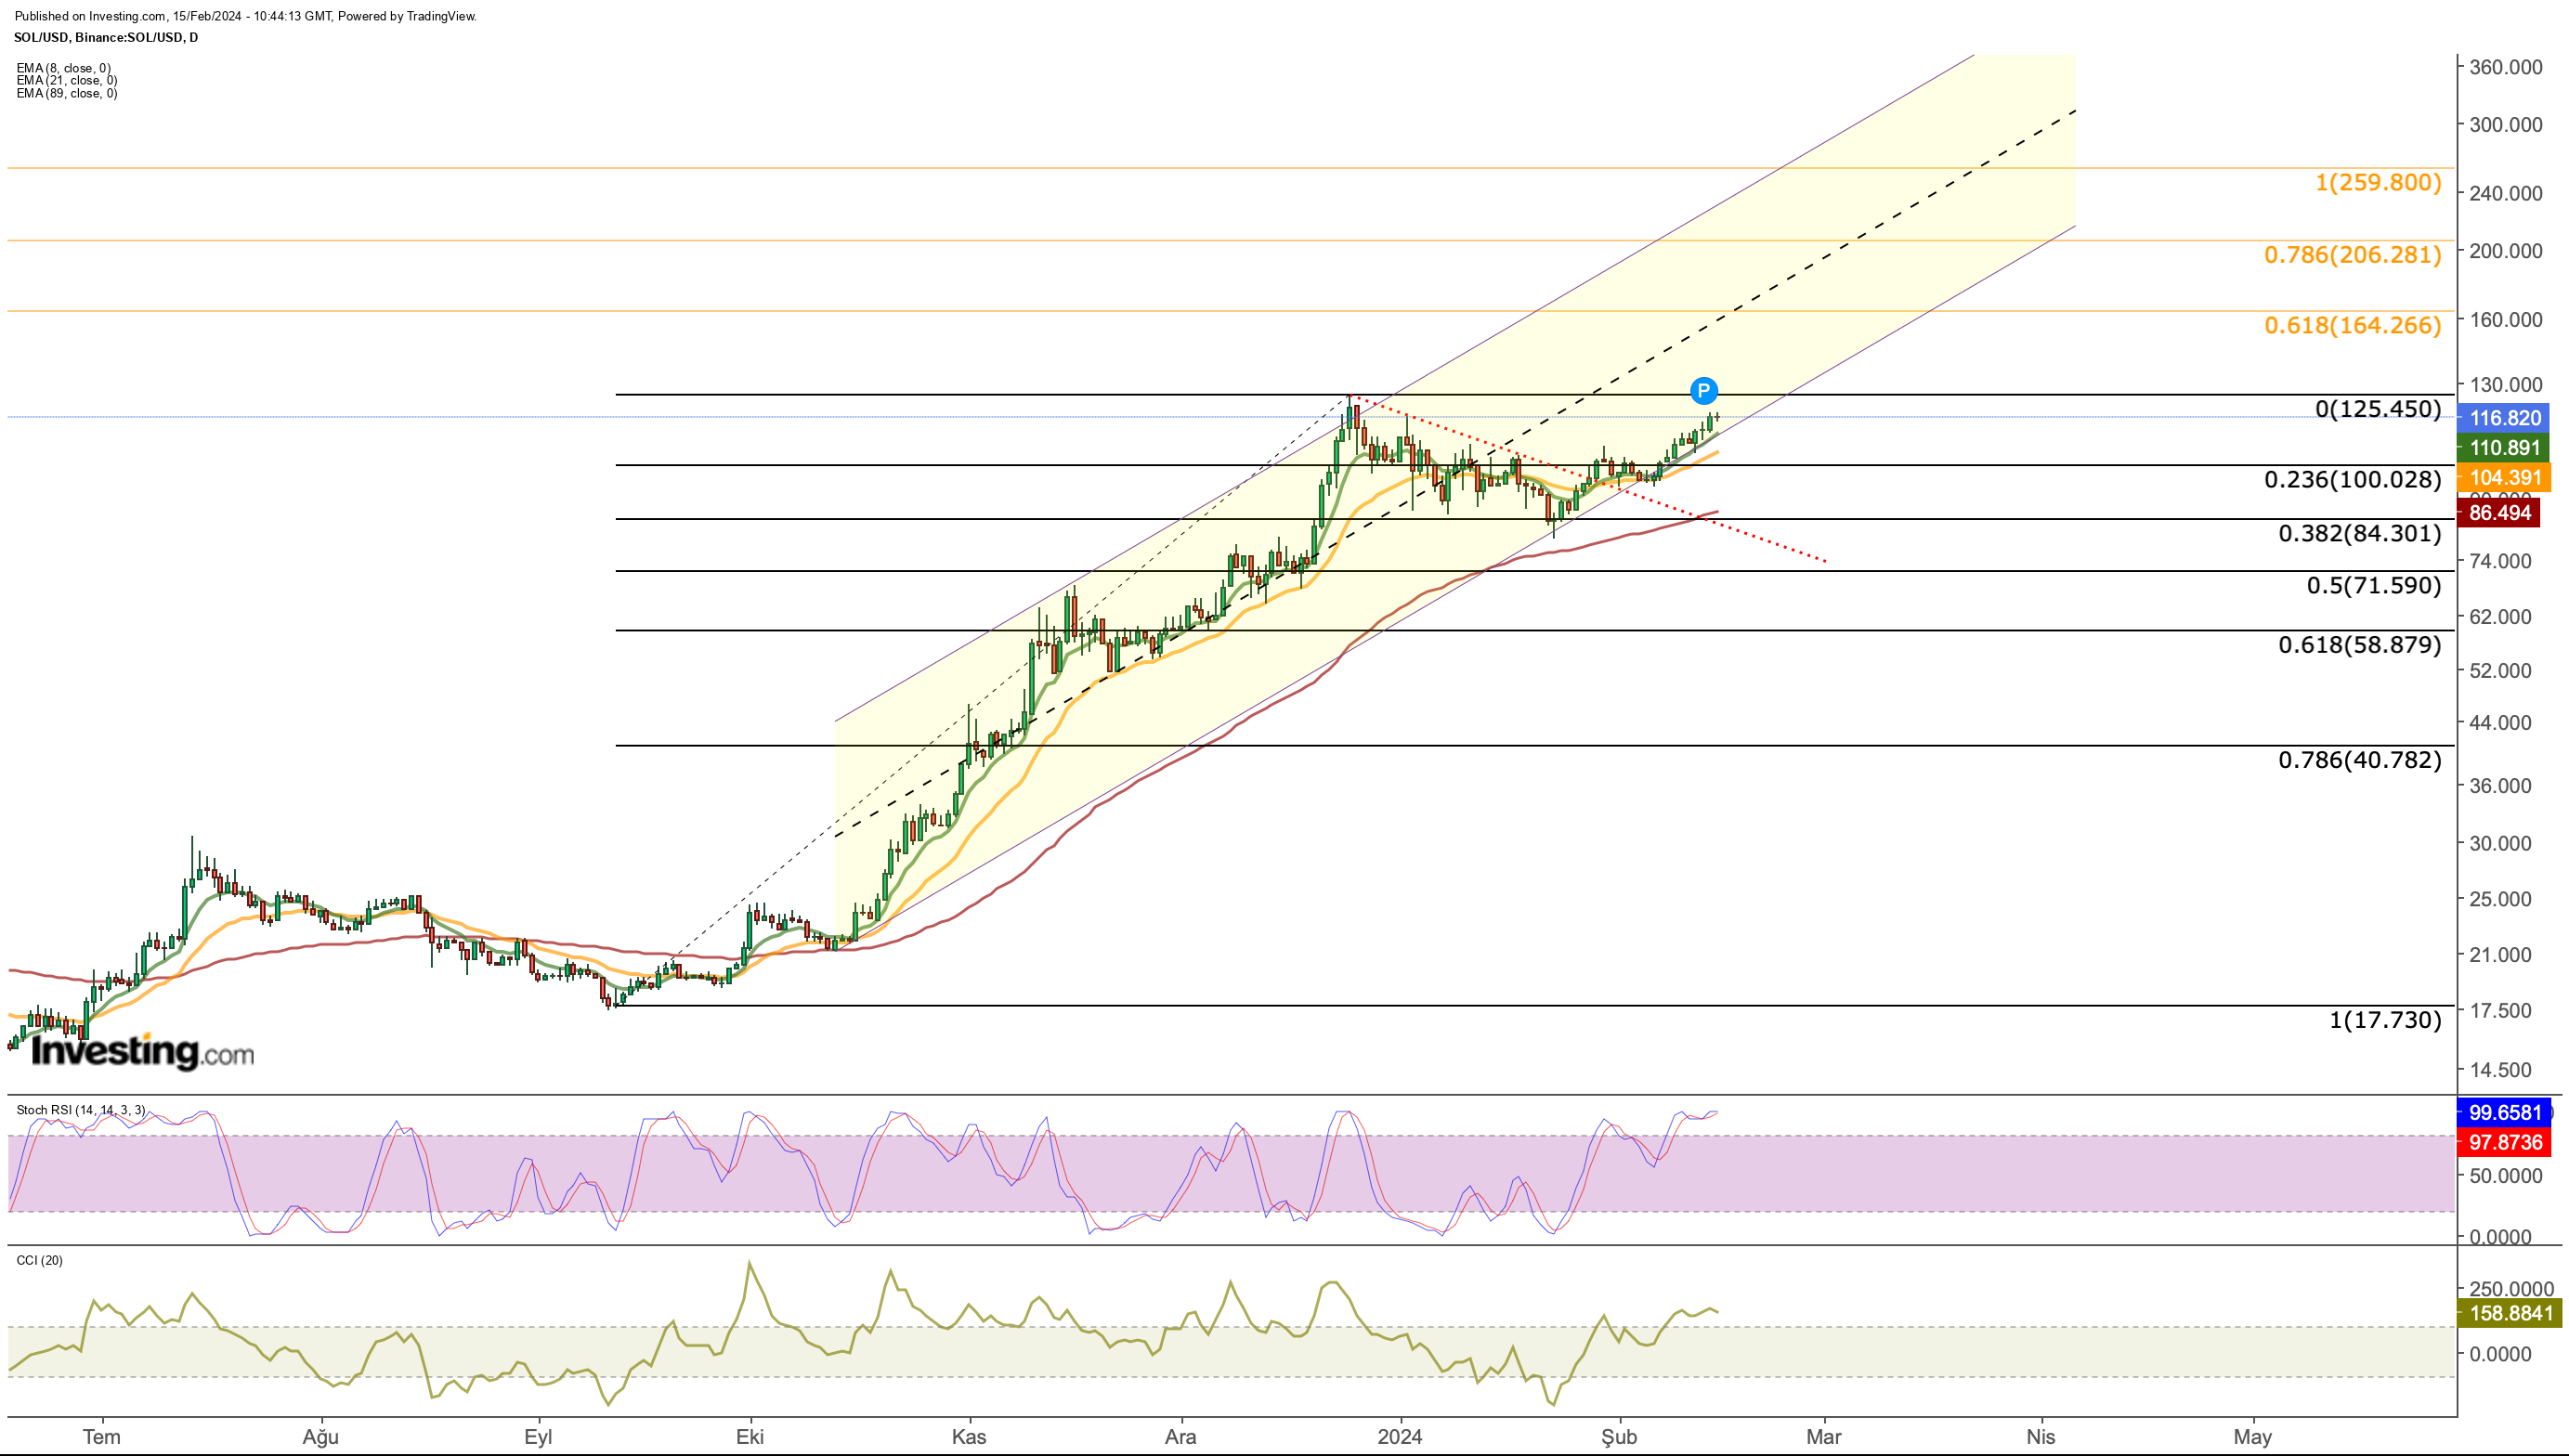
- Meanwhile, Solana has re-entered the short-term peak zone, facing resistance at $125.
- In 2024, invest like the big funds from the comfort of your home with our AI-powered ProPicks stock selection tool. Learn more here>>
This week, Bitcoin surged above $52,000 in spite of the hotter-than-expected CPI report, triggering a similar response in the altcoin market.
As a result, Ethereum gained some upward momentum, shadowing some of Bitcoin's gains. Simultaneously, Solana, which experienced a modest correction last month, re-entered the short-term peak zone this week.
This has led to some interesting technical opportunities in the crypto market. Here are two high-potential breakout setups traders should watch out for in the coming days:
1. Ethereum's Bullish Momentum Gains Traction
Continuing its uptrend which started in October, Ethereum gained momentum in February. This followed a period of sideways movement in the $2,200 to $2,400 range throughout December and January 
With the introduction of spot ETFs set to boost Ethereum's trading volume, the cryptocurrency initially surged in January but later retraced along with the broader market.
However, recent developments in the sector and upgrades to Ethereum's network have reignited optimism, propelling its value upwards once again.
Anticipation for spot ETF approval in the summer and a new network update are driving positive sentiment, alongside the milestone of a quarter of the total Ether supply being staked.
Currently, ETH is approaching its next resistance level of $2,850, based on long-term Fibonacci levels, after struggling to breach the Fib 0.382 resistance around $2,400.
Breaking through $2,850 marks a crucial step for ETH towards reaching $3,000. If daily closes above $2,850 are sustained, the Fib 0.618 level at $3,300 becomes the next short-term target, with further potential to rally toward $4,000 upon ETF approval.
In the event of short-term pullbacks, the 8- and 21-day exponential moving averages are expected to provide dynamic support, with the closest support range currently at $2,500 to $2,600.
Historical data suggests that these averages have served as reliable support lines during previous uptrends, particularly evident in the January 20 breakout where ETH bounced back from the 3-month EMA.
Additionally, on the weekly Ethereum chart, the Stochastic RSI is showing signs of turning upwards again. A sustained floor above $2,850 could trigger a bullish signal from the Stoch RSI, indicating a continuation of the uptrend in ETH prices.
2. Solana: Does the Rebound Have Legs?
During January, the correction of the September - December uptrend took place. This correction was limited at Fib 0.382, equivalent to an average of $85 according to Fibonacci measurement. 
After SOL reclaimed the $100 threshold, the current bullish momentum faces the first resistance point at the recent high price of $125.
Looking back at historical peak and bottom levels, potential resistance zones lie between the $130 to $140 range.
Beyond this range, $160, corresponding to Fib 0.618 in the long-term outlook, emerges as a crucial point for sustaining the trend.
On the downside, while $110 currently serves as SOL's nearest support level, the $100 mark remains a focal point in a potential retreat.
A breach of the $100 threshold could prompt sellers to push SOL towards the 3-month EMA level at $85.
In conclusion, the momentum SOL can gather within the $125 - $130 range holds significant importance for the trend's continuation.
***
Take your investing game to the next level in 2024 with ProPicks
Institutions and billionaire investors worldwide are already well ahead of the game when it comes to AI-powered investing, extensively using, customizing, and developing it to bulk up their returns and minimize losses.
Now, InvestingPro users can do just the same from the comfort of their own homes with our new flagship AI-powered stock-picking tool: ProPicks.
With our six strategies, including the flagship "Tech Titans," which outperformed the market by a lofty 1,427.8% over the last decade, investors have the best selection of stocks in the market at the tip of their fingers every month.
Subscribe here and never miss a bull market again!
Don't forget your free gift! Use coupon code INVPROGA24 at checkout for a 10% discount on all InvestingPro plans.
Disclaimer: This article is written for informational purposes only; it does not constitute a solicitation, offer, advice, or recommendation to invest as such it is not intended to incentivize the purchase of assets in any way. I would like to remind you that any type of asset, is evaluated from multiple points of view and is highly risky and therefore, any investment decision and the associated risk remains with the investor.

