In this dogwifhat (WIF) price prediction 2024, 2025-2030, we will analyze the price patterns of WIF by using accurate trader-friendly technical analysis indicators and predict the future movement of the cryptocurrency.
dogwifhat (WIF) Current Market Status
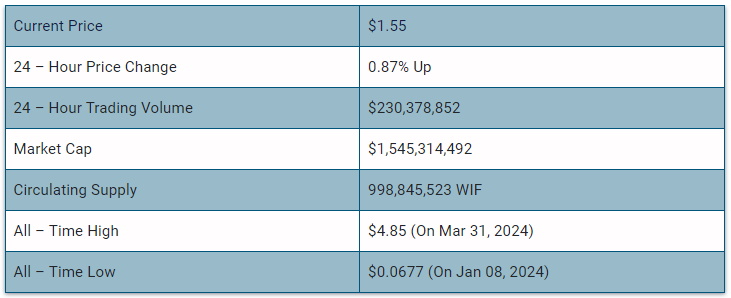
What is dogwifhat (WIF)?

With a market cap of around $4 billion, Dogwifhat (WIF) is now the third biggest meme coin after DOGE and SHIB – a feat it achieved within four months of its launch. The project’s success is attributed to its catchy meme concept of a dog wearing a hat.
Additionally, WIF’s rise has also positively impacted Solana’s recovery, as investors had to buy SOL to convert it into WIF. Further, the community’s ambitious fundraising campaign to display their meme on the Las Vegas Sphere raised nearly $700,000.
WIF 24H Technicals
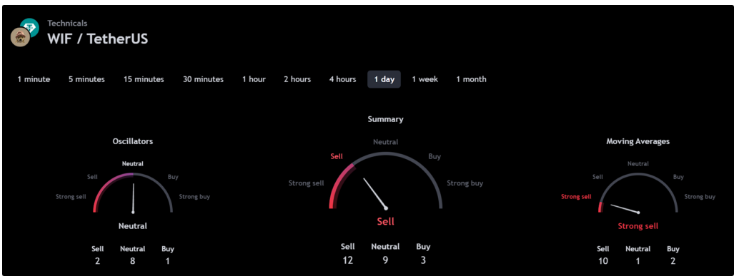
(Source: TradingView)
dogwifhat (WIF) Price Prediction 2024
dogwifhat (WIF) ranks 48th on CoinMarketCap in terms of its market capitalization. The overview of the WIF price prediction for 2024 is explained below with a daily time frame.
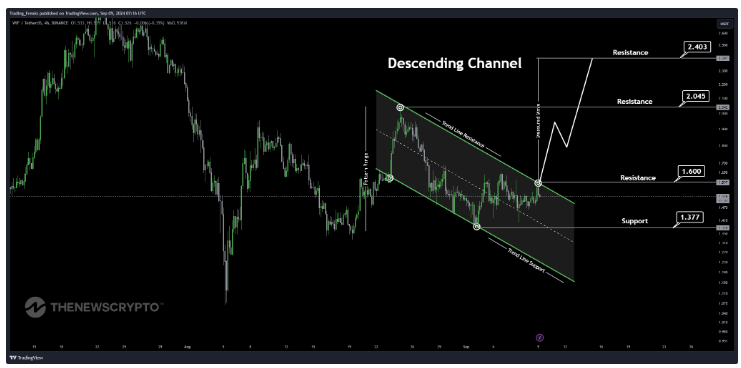
WIF/USDT Descending Channel Pattern (Source: TradingView)
In the above chart, dogwifhat (WIF), laid out a Descending Channel pattern. Descending channel patterns are short-term bearish in that a stock moves lower within a descending channel, but they often form longer-term uptrends as continuation patterns. The descending channel pattern is often followed by higher prices. but only after an upside penetration of the upper trend line. A descending channel is drawn by connecting the lower highs and lower lows of a security’s price with parallel trendlines to show a downward trend.
Within a descending channel, a trader could make a selling bet when the security price reaches its resistance trendline. An ascending channel is the opposite of a descending channel. Both ascending and descending channels are primary channels followed by technical analysts.
At the time of analysis, dogwifhat (WIF) was recorded at $1.55. If the pattern trend continues, then the price of WIF might reach the resistance levels of $1.600, $2.045, and $2.403. If the trend reverses, then the price of WIF may fall to the support of $1.377.
dogwifhat (WIF) Resistance and Support Levels
The chart given below elucidates the possible resistance and support levels of dogwifhat (WIF) in 2024.
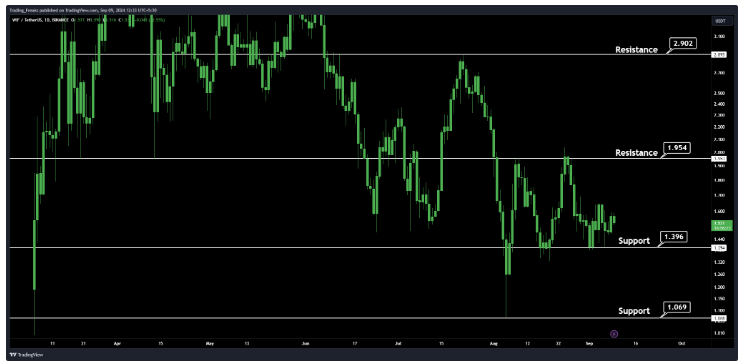
WIF/USDT Resistance and Support Levels (Source: TradingView)
From the above chart, we can analyze and identify the following as resistance and support levels of dogwifhat (WIF) for 2024.

WIF Resistance & Support Levels
dogwifhat (WIF) Price Prediction 2024 — RVOL, MA, and RSI
The technical analysis indicators such as Relative Volume (RVOL), Moving Average (MA), and Relative Strength Index (RSI) of dogwifhat (WIF) are shown in the chart below.
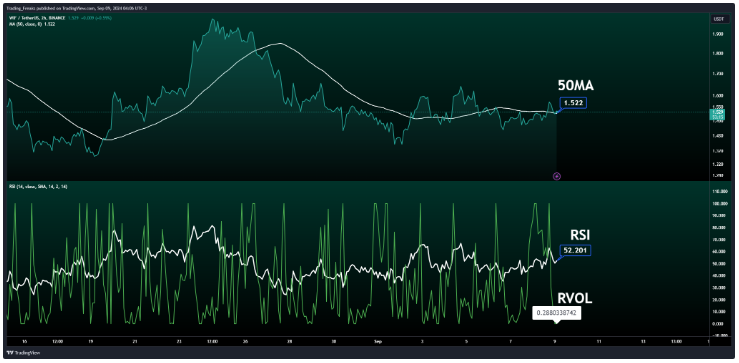
WIF /USDT RVOL, MA, RSI (Source: TradingView)
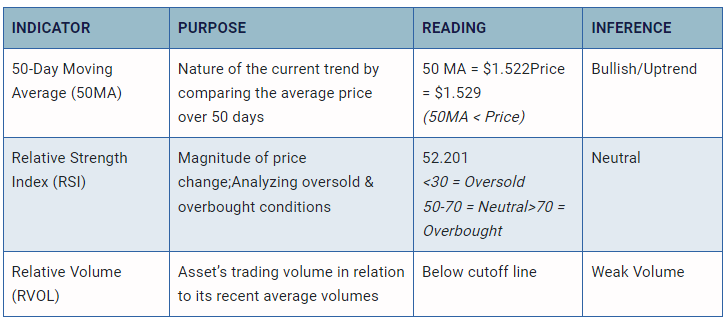
From the readings on the chart above, we can make the following inferences regarding the current dogwifhat (WIF) market in 2024.
dogfight (WIF) Price Prediction 2024 — ADX, RVI
In the below chart, we analyze the strength and volatility of dogwifhat (WIF) using the following technical analysis indicators — Average Directional Index (ADX) and Relative Volatility Index (RVI).
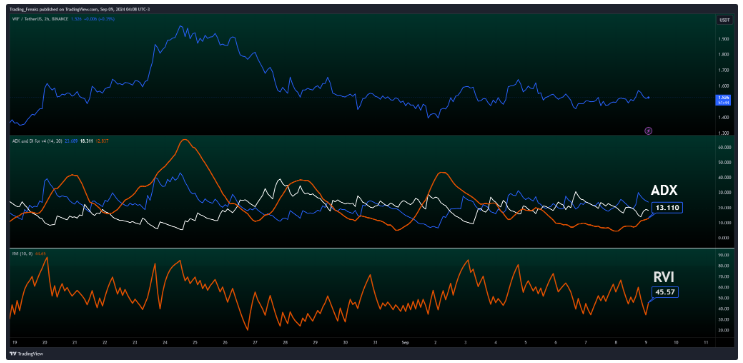
WIF/USDT ADX, RVI (Source: TradingView)
From the readings on the chart above, we can make the following inferences regarding the price momentum of dogwifhat (WIF).

Comparison of WIF with BTC, ETH
Let us now compare the price movements of dogwifhat (WIF) with that of Bitcoin (BTC), and Ethereum (ETH).
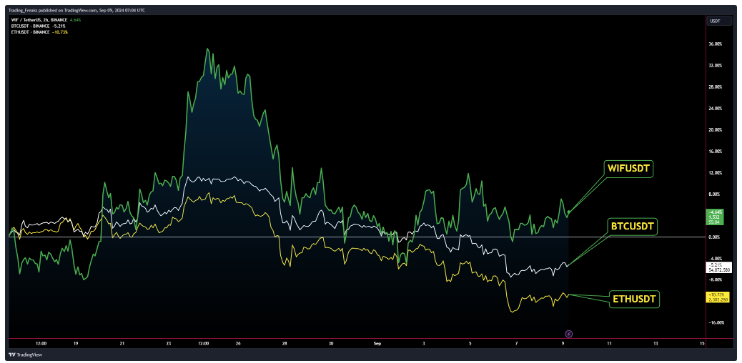
BTC Vs ETH Vs WIF Price Comparison (Source: TradingView)
From the above chart, we can interpret that the price action of WIF is dissimilar to that of BTC and ETH. That is, when the price of BTC and ETH increases, the price of WIF decreases, if the price of BTC and ETH decreases, the price of WIF increases.
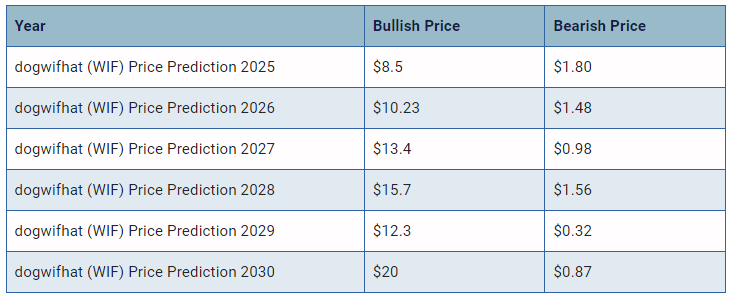
dogwifhat (WIF) Price Prediction 2025, 2026 – 2030
With the help of the aforementioned technical analysis indicators and trend patterns, let us predict the price of dogwifhat (WIF) between 2025, 2026, 2027, 2028, 2029, and 2030.
Conclusion
If dogwifhat (WIF) establishes itself as a good investment in 2024, this year would be favorable to the cryptocurrency. In conclusion, the bullish dogwifhat (WIF) price prediction for 2024 is $2.902. Comparatively, if unfavorable sentiment is triggered, the bearish dogwifhat (WIF) price prediction for 2024 is $1.069.
If the market momentum and investors’ sentiment positively elevate, then dogwifhat (WIF) might hit $10. Furthermore, with future upgrades and advancements in the dogwifhat ecosystem, WIF might surpass its current all-time high (ATH) of $4.85 and mark its new ATH.
This content was originally published by our partners at The News Crypto.
