The outlook for soybeans' demand deteriorated fast after investors acquainted themselves with the language of the signed initial agreement between the world’s two strongest trading partners. The bad news: soybean growers can no longer rely on automatic Chinese demand.
From a preset commitment to buy American soybeans, the terminology changed to a pledge to buy U.S. soybeans based on “market conditions.” In other words, based on demand back home. And if demand falls? China will reduce its orders. A primary use for soybean is pigfeed. The numbers of Chinese swine dwindled amid the recent swine fever epidemic.
As a result, we can expect Chinese demand for U.S. soybeans to drop, especially considering that tariffs on billions of dollars worth of Chinese goods remain in effect despite the signing and that the U.S. is moving to further limit sales to China’s tech giant Huawei.
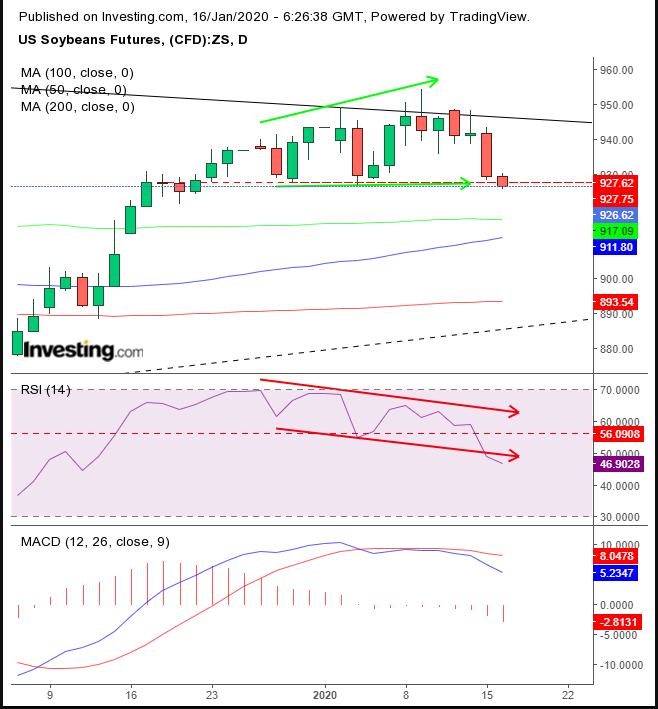
Investors didn’t waste any time in reacting, pushing prices down to the lowest since Dec. 19.

The selloff drove the contract below its $927 support level since the four sessions it required to muster enough juice to break through that price level from the downside, Dec. 17 through Dec. 20.

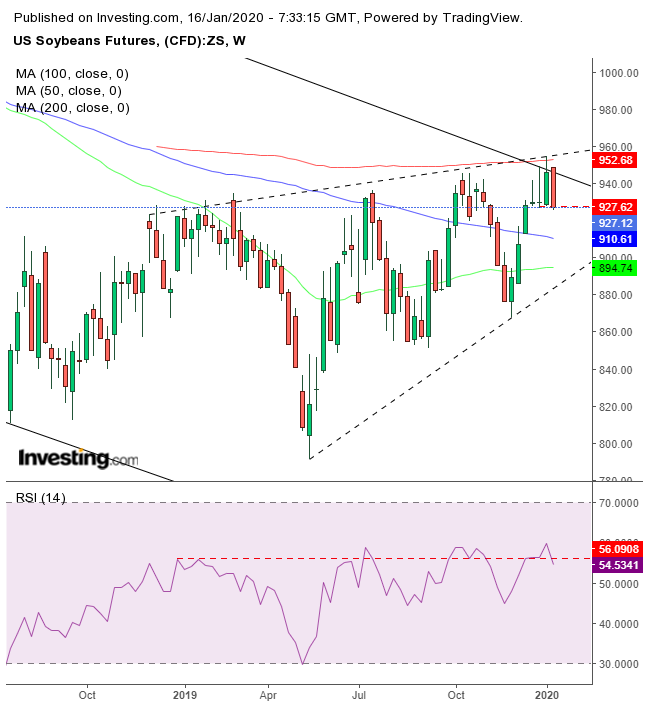
However, even during the optimism ahead of the watered-down Chinese commitment, prices were stuck below the $950 area as they found resistance by the top of a falling channel since June 2016. In the weekly chart, we also noticed that prices failed to remain above the $935 levels. True to this resistance line, while soybeans futures closed above that supply-line ahead of the trade deal, they’ve crashed back below after it.
While, the adage “buy the rumor, sell the news” may play a role, based on the fundamental change in language and technical map, we think investors have reversed their outlook on growth in sales.
In the daily chart, the price’s topping out is backed up by both the MACD – whose short-term MA fell back below the long-term MA, from an overbought condition – and the RSI – which has not only fallen back from the oversold, 70 level, but also provided a negative divergence to the price, whose lows were flat and whose highs rose.
In the weekly chart, we observe that the price action developed a rising wedge, bearish within the falling channel since mid-2016. The pattern’s presumed resistance is compounded by its top – which the price has just retested for the fourth straight week, confirming its resistance each time.
Finally, the 200-week MA is connecting the resistances of both the wedge and the channel tops. The RSI has been unable to stay above the 56 level since the beginning of December.

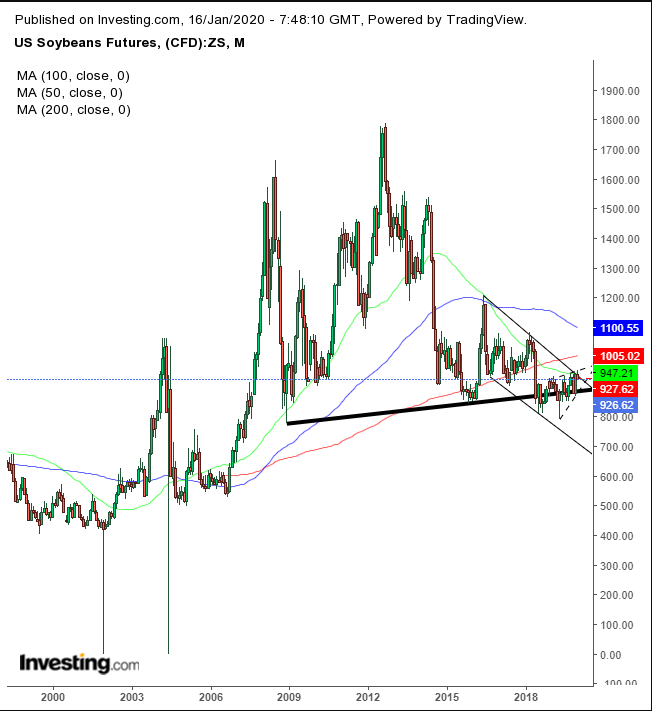
And when we take yet another step back, what emerges is potentially a massive top spanning more than a decade since the 2008 crash, the downside of which is an unknown abyss.
The fundamentals and technicals, in both the daily and the weekly charts, demonstrate that risk is to the downside.
Trading Strategies
Conservative traders would wait for a downside breakout of the wedge, below $900, before shorting.
Moderate traders could short after a closing with at least one long red candle below the $925 level, the bottom of the congestion since December, as discussed above; then, wait for a return move that would be stumped by overwhelming supply.
Aggressive traders might risk a short right after the close below the $925 level, awaiting no further confirmation that supply has drowned out demand at these levels.
Trade Sample
