Boeing (NYSE:BA) has fired Chief Executive Officer Dennis Muilenburg in an attempt to salvage the wreck of its reputation after two lethal crashes of its 747 MAX plane in just 14 months killed over 340 people.
However, concerns remain that the company is continuing to put profit before safety, after naming David Calhoun, a board member for 10 years, as chief executive and president. Families of the crash victims are calling for the company to carry out a total revamp, bringing fresh ideas and new thinking to the company's operations.
With Boeing's stock down more than 20% since the MAX was grounded after the March 10 Ethiopian Air crash, can the Muilenburg ouster turn the price around? Despite the initial boost to the shares after the announcement, we bet it won’t.

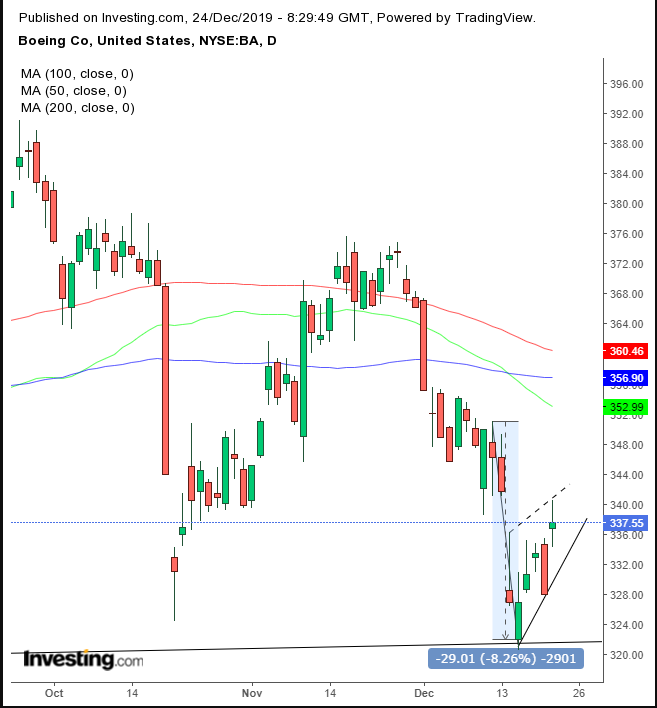
The stock jumped 2.9% immediately after the news. However, it found resistance by the December congestion. If this one measure could have done the trick, there would have been a much more dramatic leap. If the stock returns now toward the $332 area it would trade according to a rising flag, bearish after the 8.25% drop in the two days of Dec. 13 and 16.
The pattern suggests that the rise is due to profit-taking after the sudden drop, as investors catch their breath and gauge the market. The congested upward rise indicates that the supply is being absorbed, signaling that bears are still in charge. A downside breakout signals another leg down, showing that sellers were eager enough to sell to lower prices to find new buyers, after drowning out the demand within the flag.
But that’s not all. A downside breakout would call for a target equivalent to the prior move, the 8.25% drop. If that follows through, the price would complete another, much more significant pattern.

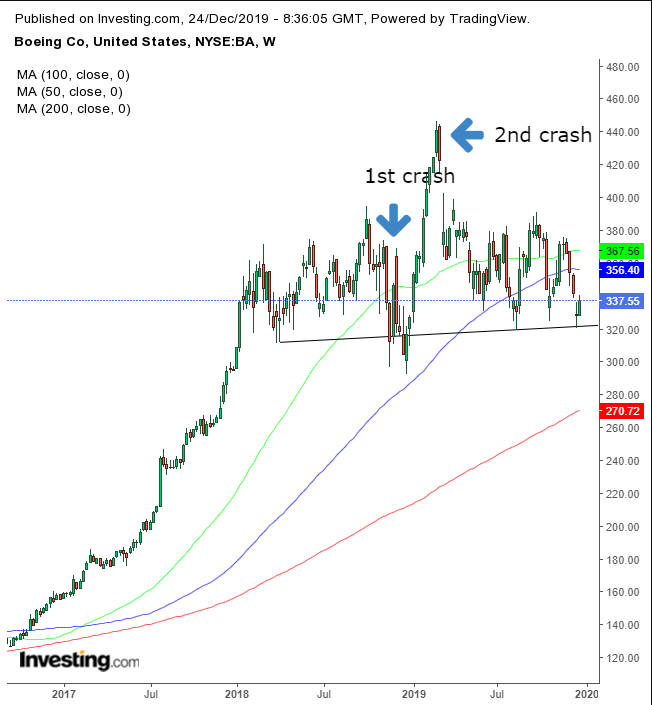
The stock has been trading within a massive H&S top pattern since February 2018, which may have been put into place after the first crash in October 2018.
The price is already below the 50 and 100 WMA. If the price falls below the $320 neckline, it would signal a reversal. As with the flag, desperate sellers would be willing to lower their asking price to find new buyers. If they don't find them, they'll continue to lower their prices. This would create a panic, provoking other sellers to sell. And just to reach the 200 DMA implies a $50 drop, which is a long way down.
Trading Strategies
Conservative traders would wait for a close below $311, to establish a 3% filter, to weed out a bear trap, before committing to a short position.
Moderate traders may wait for the flag completion, including a price that closes below the continuation pattern for a couple of days, then returns to retest the resistance of the flag.
Aggressive traders may short now, provided they understand the risk of lack of confirmation for the pattern and have planned entries and exits that they stick to and that offer a workable risk-reward ratio.
Trade Sample
