The Australian dollar has been slipping fairly steadily since the Reserve Bank of Australia opted two weeks ago not to raise interest rates. The central bank's rationale: to avoid spurring additional borrowing even as local house prices rise and fears of a bubble escalate.
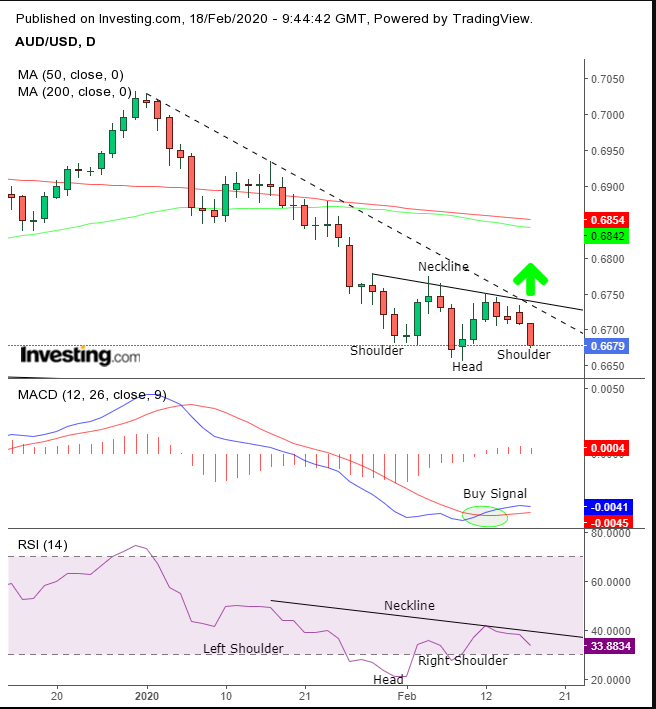
The most recent slide for the struggling Aussie continued today, for a fourth day. However, the supply / demand tug-of-war is producing a pattern that's consistent with a bottom.

While the AUD/USD has been slumping for the fourth consecutive day, the pair is finding support precisely at the level where the lows occurred during the last trading day of January and the first trading day of February. The Feb. 7 low, however, was lower, suggesting a H&S bottom.
The market mechanics of the formation—with its lower lows from the left shoulder and the head—signals that bears are confident of their control. However, when the right shoulder fails to keep that downtrend consistent, traders begin to notice.
Note, also, that even the falling troughs between the left shoulder and the head were congested, leaving one of two options: either supply is not eager, or demand is picking up whatever supply is being provided. Or both. Either way, bulls are starting to change the conversation.
Note, the RSI has been developing a H&S bottom of its own, demonstrating momentum is consistent with the price’s potential reversal. The MACD also provided a buy signal, but only when the shorter MA crossed above the longer MA.
The 50 DMA climbed until it reached the 200 DMA and has been moving along right beneath it. An upside breakout of the price pattern would pull the 50 DMA above the 200 DMA, triggering a golden cross.
Trading Strategies
Conservative traders should wait for an upside breakout, including a close above the 200 DMA, then wait for a return move that would successfully test the support of the H&S neckline, for a long position.
Moderate traders would wait for a close above 0.6800, the round number above the highest post of the pattern. Then, they’d wait for a pullback for a better entry for a long position, not necessarily for confirmation of trend.
Aggressive traders may risk a long position now, before the price takes on the neckline, which for now remains a resistance.
Trade Sample
- Entry: 0.6680
- Stop-Loss: 0.6670, below the day’s low
- Risk: 10 pips
- Target: 0.6710
- Reward: 30 pips
- Risk:Reward Ratio: 1:3
