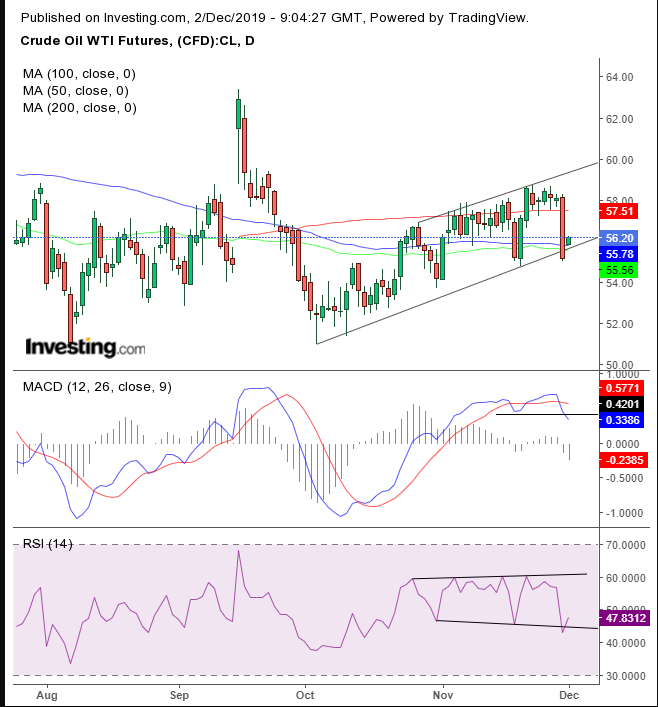
WTI may be gearing up for a big comeback. With the outlook shifting fast around talk of deepening OPEC/OPEC+ cuts and indications China’s economic slowdown might be turning a corner, it's becoming likely oil will extend its rally from the Oct 3, $50.99 bottom.
Iraq jarred the oil market on Sunday when its oil minister, Thamir Ghadhan, said an extra 400,000 barrel a day cut is in play, signaling OPEC and other producing countries might consider cutting production further. This contradicts Friday’s indication that OPEC and friends will, in fact, not reduce production.
RBC Capital Market’s Helima Croft thinks that:
“Barring any dramatic developments, the emphasis will be likely be on further tightening the market through better compliance enforcement. Such a compromise might give prices a slight bump up, while actual further cuts would shoot it upward."
China’s manufacturing PMI expanded for the first time since April, signaling that China’s contraction might be bottoming, suggesting a recovery may be on the way. This would bring with it an increase in demand for oil by the world’s largest oil importer. Of course, we're wary of jumping on the wagon of a single monthly piece of data since it may purely be a result of the heightened optimism around the potential for a Phase 1 of the long-awaited trade agreement between the U.S.and China.
Nonetheless, for now, oil opened 1.2% higher today and extended its climb to 1.5%.

Today’s surprise rebound put the price squarely back within its rising channel since the Oct. 3 bottom, as well as allowing it to scale above the 50 and 100 DMAs.
The RSI also rebounded within its own channel — though sideways, not rising like the price. On the one hand, this suggests less energy than had the channel been rising, while on the other hand, it indicates a more sustained climb as momentum returns to the RSI’s 60.00 sideways channel top.
The MACD, however, is squarely bearish, with the shorter MA having fallen below the longer MA from an overbought condition, as it completes a double top.
The contradictory outlook among the indicators reflects the conflicting fundamental outlook of further OPEC+ cuts.
However, considering the price is at the bottom of the rising channel, it provides an attractive risk-reward ratio for traders who want to trade the range.
Trading Strategies
Conservative traders would wait for a pullback that would retest Friday’s $55.02 lows, which will prove successful after it closes back above the channel bottom, establishing accumulation.
Moderate traders may wait for a downward correction for a better entry, not necessarily for evidence of demand.
Aggressive traders may enter at will, provided they understand and accept the risk.
Trade Sample:
