The dollar rose on Wednesday for the fourth day in five, hitting a more than two-month high.
The global reserve currency is rising as part of a “reflation trade.” Reflation occurs when fiscal and monetary polices are put in place to increase economic output and remove uncertainty following a recession. Which perfectly describes the current situation.
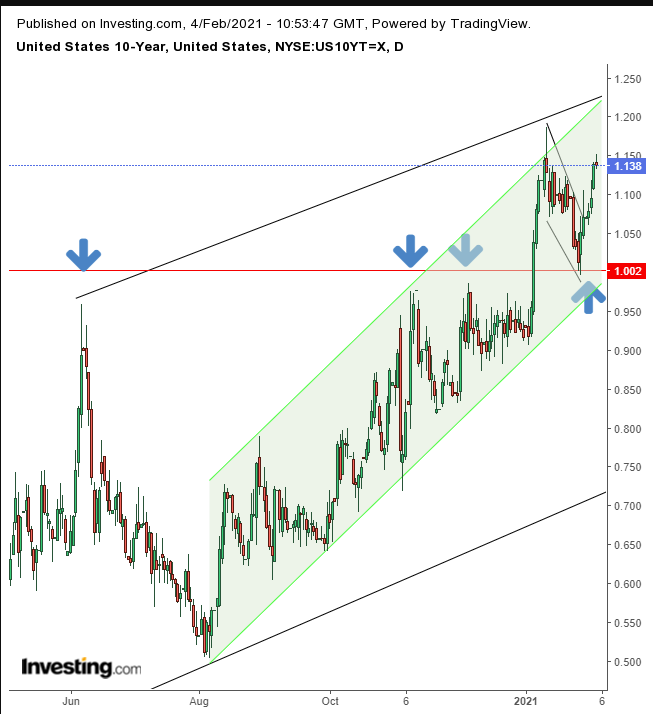
Yields are rising, as investors sell Treasuries on the expectation they will be able to buy new issues with higher interest rates in the future. Treasury prices and yields are inversely correlated, so when the price Treasuries falls, yields rise.

The 10-year Treasury yield completed a bullish flag, helping yields along a steeper rising channel. Notice how the 1.00% level is a critical position, first acting as resistance, then flipping to support.
Rising yields attract capital from foreign investors, who must first buy dollars with which to purchase the sovereign bonds. This increased buying drives the price of the currency higher when supply runs out.
This pattern accelerates as foreign currencies lose their value, and are then sold off in favor of additional USD buying.
The greenback took a hit each time US fiscal stimulus dominated market headlines. Traders assumed that any increase in the US national debt as well as an increase in the supply of dollars would weigh on the currency. So they sold out of dollars.
At the end of January we made the case for a dollar bottom for technical and fundamental reasons. It now appears the bullish patterns have completed, potentially bottoming out the dollar.

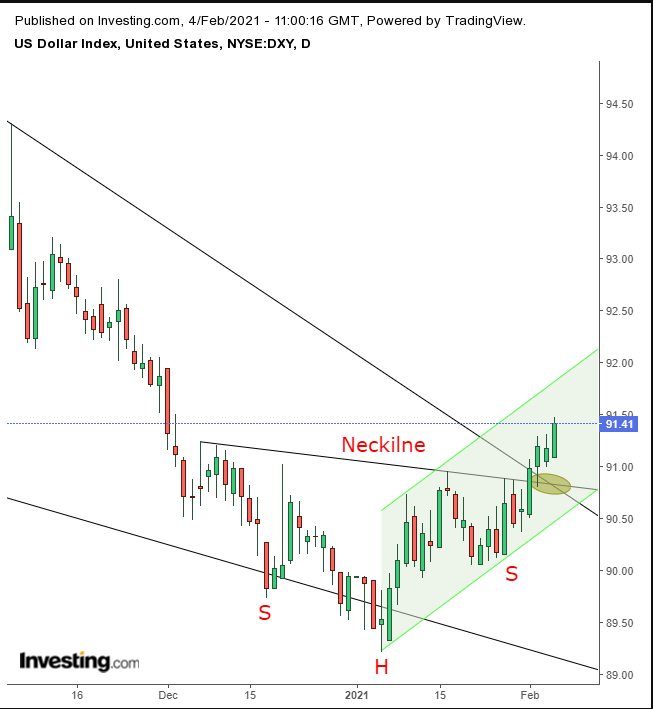
Accelerating bids chased the dollar higher, along a rising channel since the Jan. 6 low of 89.21, helping push the greenback through the neckline of a small H&S bottom.
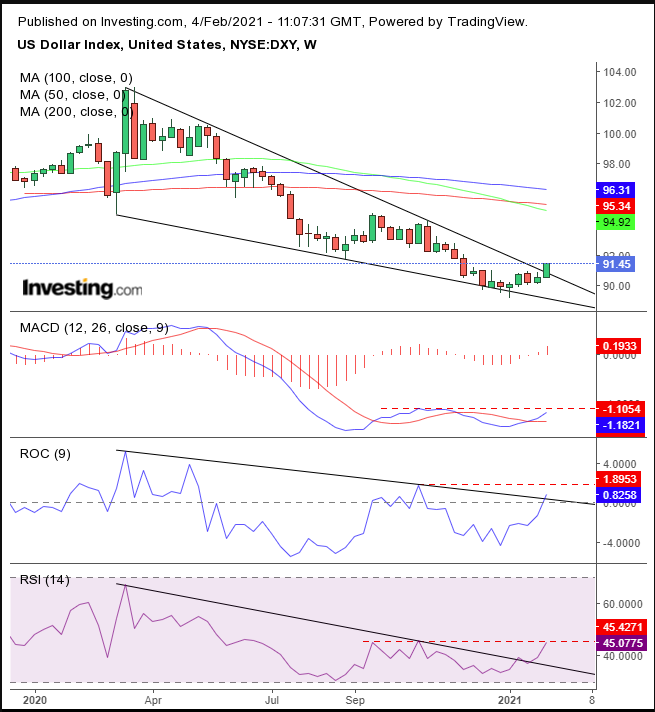
However small the H&S bottom is, it served to help the USD complete a much larger pattern, visible via the weekly chart.

The dollar just broke out to the upside of the wedge. However, dollar bulls will probably have their work cut out for them. Remember the fundamental argument regarding the impact on the most generous fiscal and monetary policy in history?
From a technical perspective, the 50-week MA just recently crossed below the 200-week MA, a major Death Cross, with ominous implications, putting the dollar on a momentum-path to continue quite a way lower.
Accordingly, the MACD—which is based on price average interplays—and both the RSI and ROC momentum-based indicators appear to be bottoming.
However, they require scaling higher than previous highs to provide meaningful bullish signals. Accordingly, the price needs to post a rising series of peaks and troughs for the uptrend to take hold of market mechanics.
Trading Strategies – Long Position Setup
Conservative traders should wait for at least two weekly peaks and troughs to register, before jumping on what will only turn into a bandwagon.
Moderate traders could enter a long position when the price reaches 93.00, then falls to find support above the H&S bottom and wedge.
Aggressive traders—who understand and accept the risks, based on the fundamental and technical conflicts—would risk a long position when it suits their carefully prepared trading plan.
Here is an example:
Trade Sample
- Entry: 91.00
- Stop-Loss: 90.00
- Risk: 100 pips
- Target: 94.00
- Reward: 300 pips
- Risk:Reward Ratio: 1:3
Author's Note: As you can see, there is a fundamental argument as to how monetary fiscal policy will impact the market, which is made up of all the world’s individuals, and is therefore impossible to predict. The technicals have begun to show signs of a bottom, but the weekly death cross and lack of weekly rising peaks and troughs indicate the current rebound could fizzle and resume along the downtrend, which is still in place.
We don’t know what will happen. We are simply playing the odds and advising on how to manage your luck. The trade sample is just one way to approach this trade. Write one to suit your budget, temperament and timing. Till you learn how to do that, experiment with small amounts. Happy trading!
