Carvana stock soars after S&P 500 inclusion announcement
- Cryptocurrency markets have been revived by Bitcoin's surge to $35,000
- Altcoins like Solana, Ripple, Chainlink, and Dogecoin have joined the rally
- Solana is targeting $40, as Ripple moves above $0.55, Chainlink breaks out, and Dogecoin aims for $0.097
After a period of dwindling risk appetite in cryptocurrency markets due to geopolitical uncertainties and higher rates, a revival in enthusiasm is now being driven by the industry's internal dynamics.
Cryptocurrencies entered October with a bearish tone, but a significant uptick in demand during the latter half of the month turned the tide.
This resurgence, led by Bitcoin, has now spilled over into the altcoin market, mirroring the momentum experienced back in June. Once again, the rally is primarily propelled by the progress made in the development of a Bitcoin ETF.
The cryptocurrency world was abuzz with anticipation following the announcement of Actions related to the ETF product, driving an increased demand for Bitcoin and pushing its price up to the $35,000 mark.
While Bitcoin's ascent appears to be slowing down as it approaches the $35,000 threshold, the cryptocurrency continues to demonstrate resilience within the $34,000 range.
Furthermore, the recent horizontal trajectory of Bitcoin, which has seen an impressive surge of over 20% in the last week, is paving the way for various altcoins to make their moves.
In terms of trading volumes over the past 24 hours, the top-performing altcoins, following Ethereum, include Solana, Ripple, Chainlink, and Dogecoin.
Solana: Can the Price Surge Continue?

Solana has been on a steady rise in recent months, especially as an altcoin in demand by institutional investors. According to CoinShares data, there has been an increase in demand for Solana-based mutual funds, while interest in Ethereum, its biggest competitor in this area, has decreased significantly.
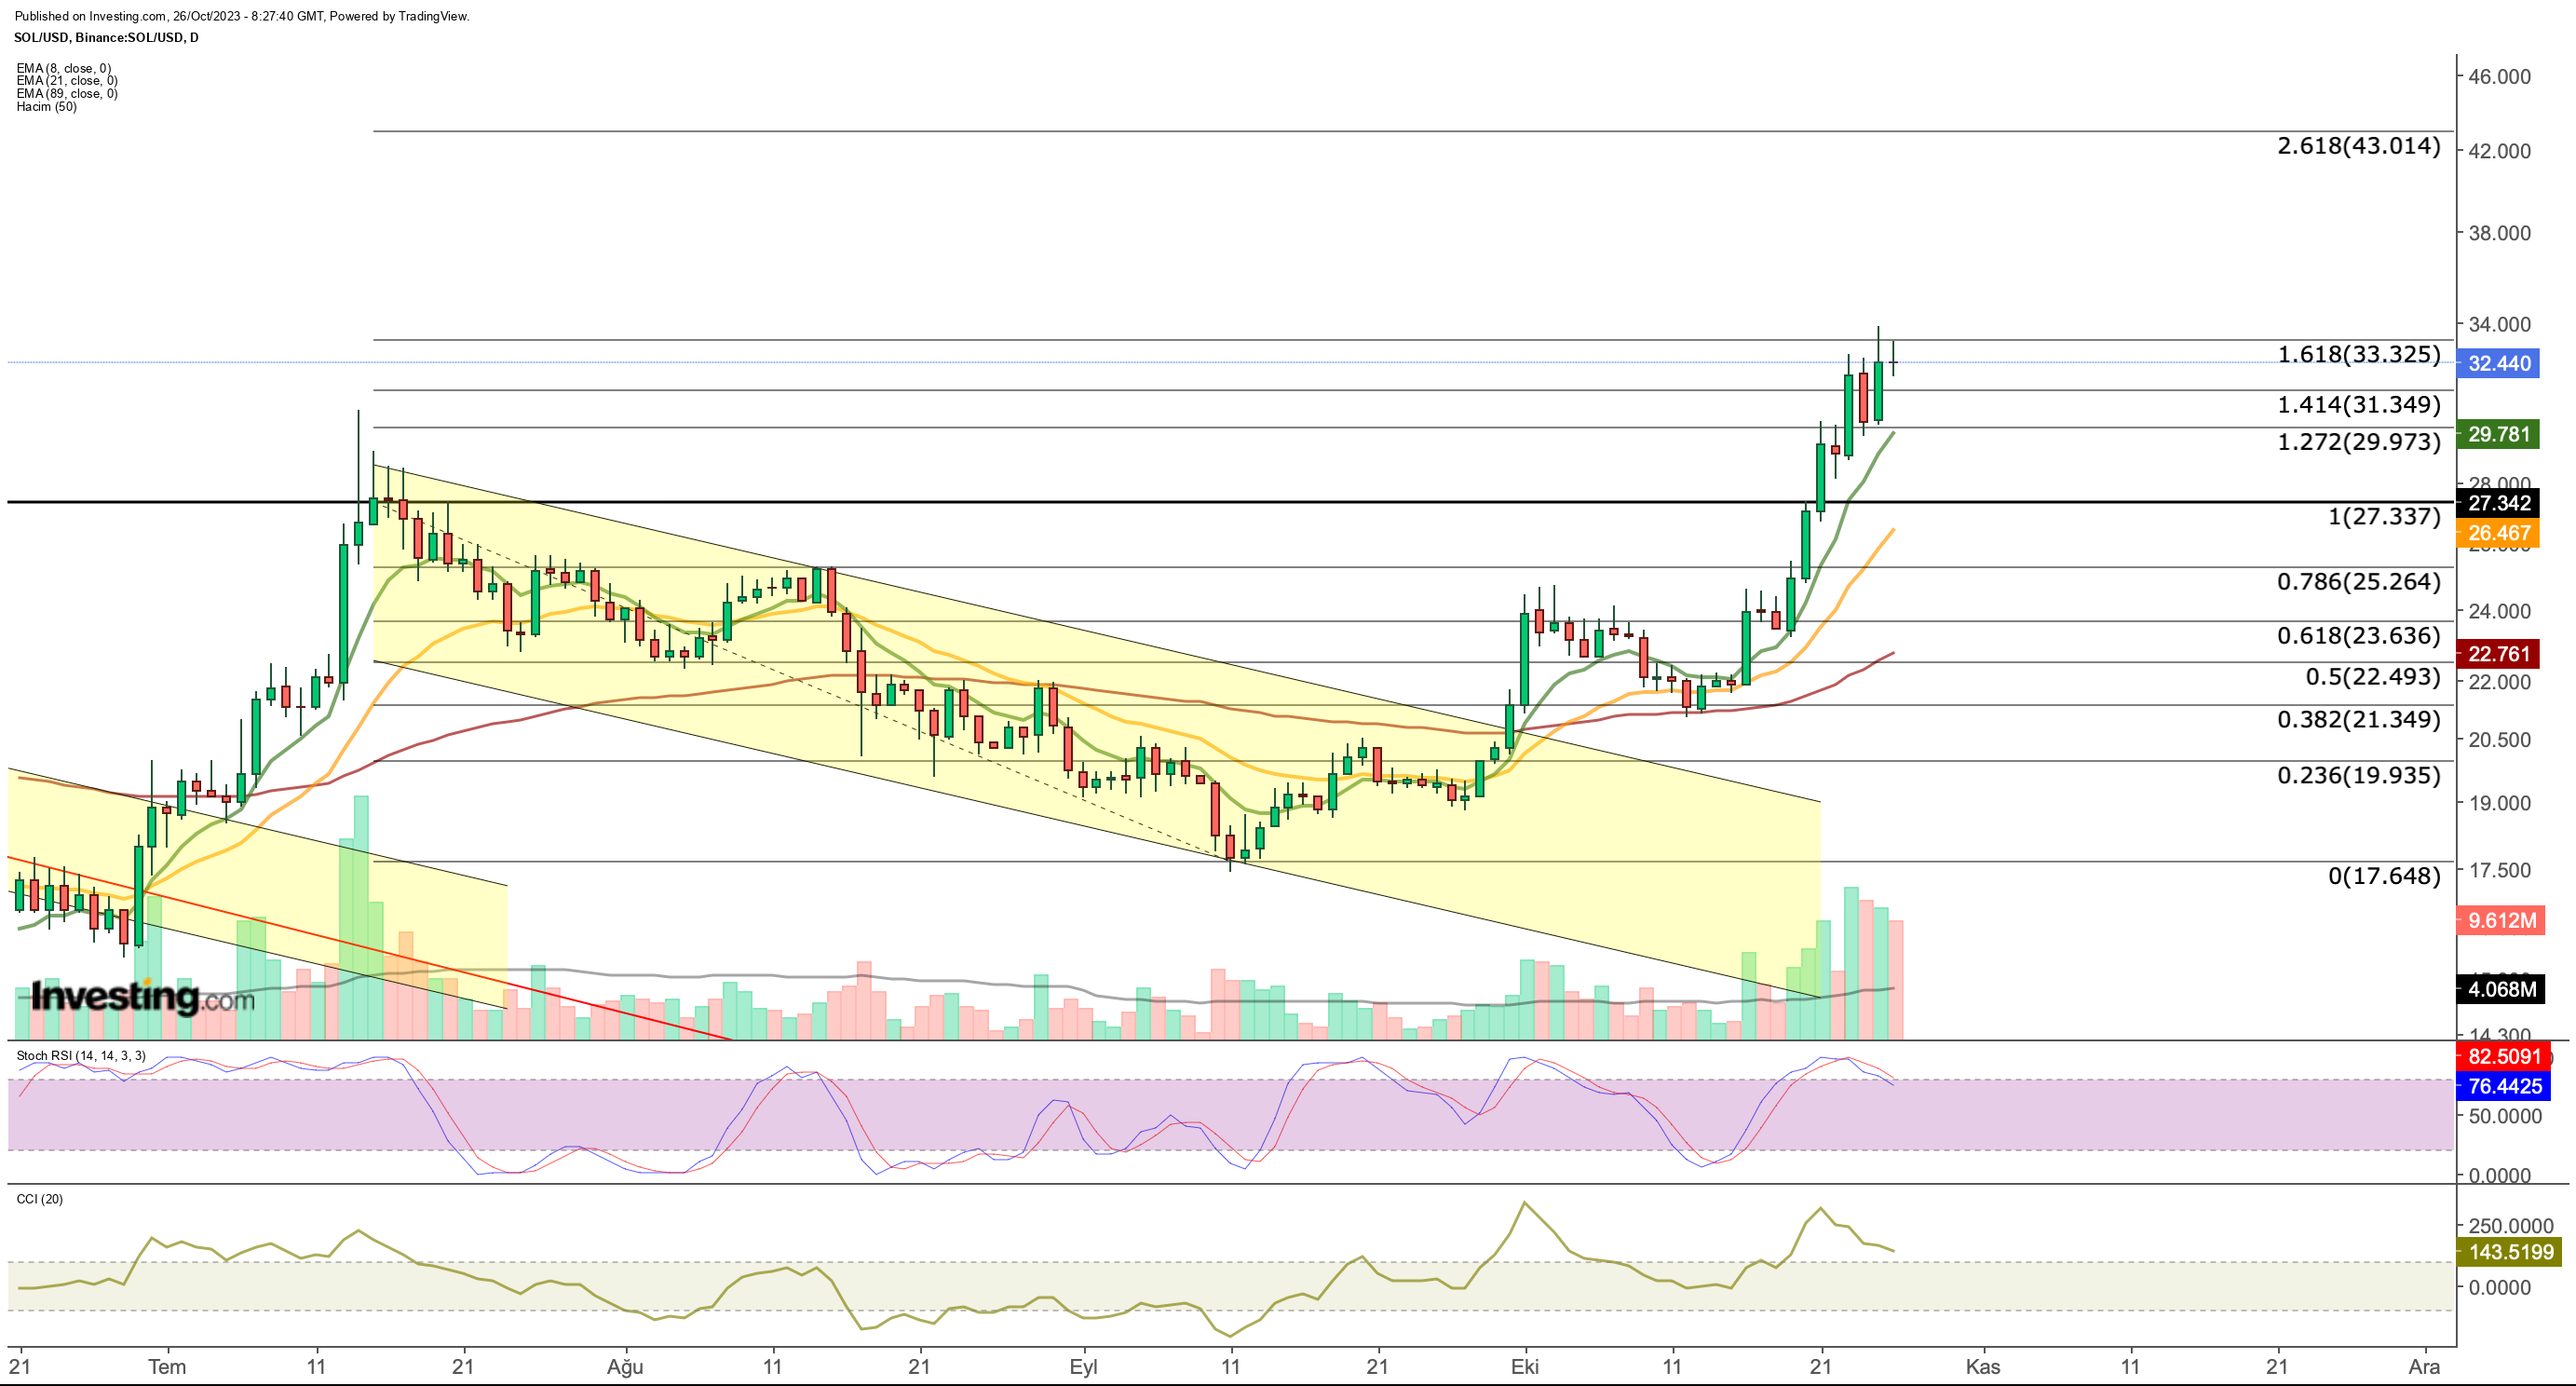
This activity has also affected the price of Solana, with the cryptocurrency starting to end its recent short-term downtrend in the $17 region in September. A bounce in early October led to an upside breakout of the falling channel, and Solana has rallied steeply over the past two weeks, with support at $21 after a brief backtest.
In the last bullish phase, the fact that SOL remained above the 3-month EMA was an important indicator. The cryptocurrency, which rose as high as the $33 band this week, is seen to have reached the Fibonacci expansion zone Fib 1,272 - Fib 1,618 range, based on the recent downward momentum.
Accordingly, SOL may see weakening demand in this region. While $33.3 is seen as the closest resistance for cryptocurrency, we can see that profit sales will start to accelerate as daily closes below this level. The nearest support point is seen at an average of $29.8.
In a positive scenario, even if SOL breaks its support at $29 if it manages to hold on to the range of $26 to $27, the last peak in July, it can continue its trend from where it left off and target the $40 band as the next move.
The fact that the trend is showing signs of weakening in the Fibonacci expansion zone and the Stochastic RSI is losing momentum from the oversold zone on the daily chart strengthens the possibility of a correction from these regions.
In summary, if the sagging up to the $26 - $27 range in the possible correction is considered a buying opportunity by investors, the cryptocurrency will gather strength to rise up to $ 40 in the short term.
Otherwise, it may be possible to see a correction to the $ 22 - $ 23 range.
Ripple Finally Breaks Sideways Pattern
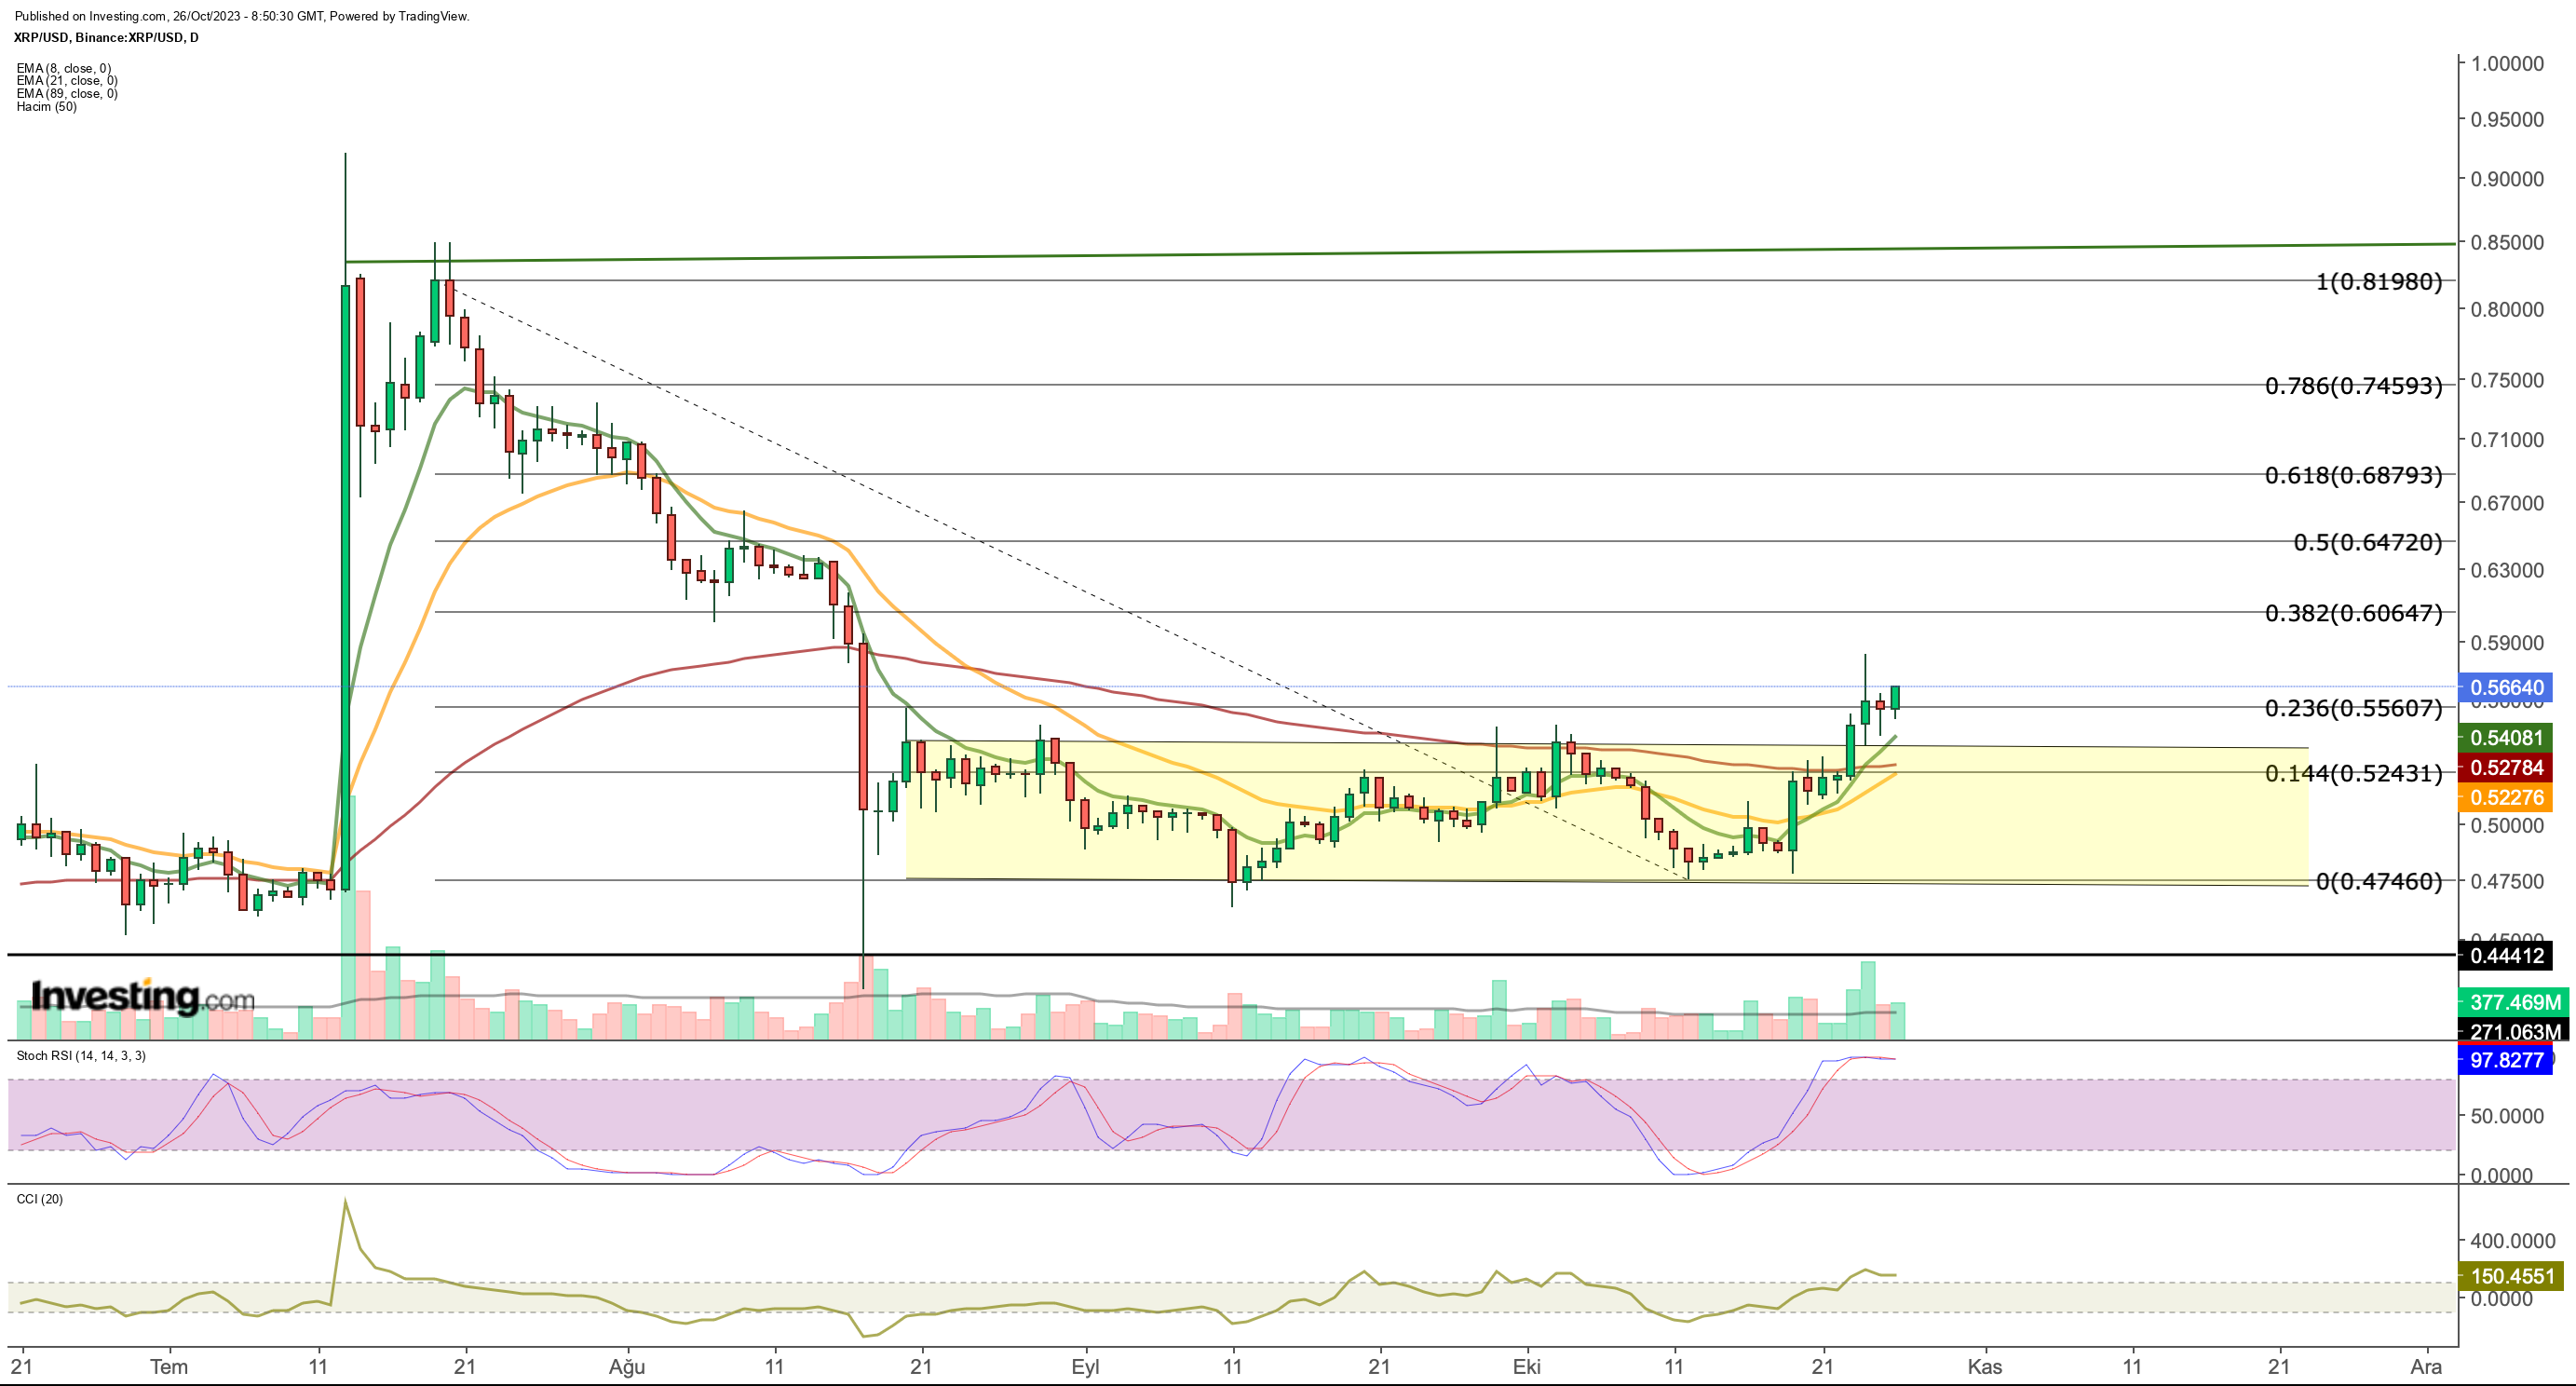
XRP broke the sideways movement that it has been in since August with this week's rise to the upside. While the average of $0.535 worked as a resistance point for XRP, the $0.47 level formed the lower band of the channel.
Although the cryptocurrency lagged behind the performance of Bitcoin and some major altcoins with a 15% increase in value in the last 7 days, it was a technically important move to break its sideways movement.
However, there are two critical resistances for XRP to extend its uptrend into the long term. XRP first needs to establish a floor above the $0.55 band, which corresponds to Fib 0.236 according to the last retracement.
We can see that XRP, which has been struggling at a resistance level for the last 48 hours, may retreat to $0.52 for the rest of the week and receive a confirmation from the nearest support zone.
If the short-term EMA values add up to form a firm support point at $0.52, XRP is likely to move quickly to the second resistance level at $0.6 (Fib 0.382).
Looking at the daily chart from a slightly wider perspective, it is important for XRP to close above $0.55 for the week in order to talk about the end of the band movement.
We can see that short-term EMA values also generate signals to support the rise by exceeding this price level.
However, since the current strain indicates a slowdown in demand, we may see the cryptocurrency oscillate between $0.52 and $0.55 for the next few days.
In summary, after the resistance of $ 0.55 in the upside region, $0.6 will be followed as the point that will determine the direction of the trend.
In the lower zone, if daily closes below $0.52 surge, we can see that the main support point of $0.47 can be tested once again.
Chainlink Breaks Out Amid Rising Trading Volume
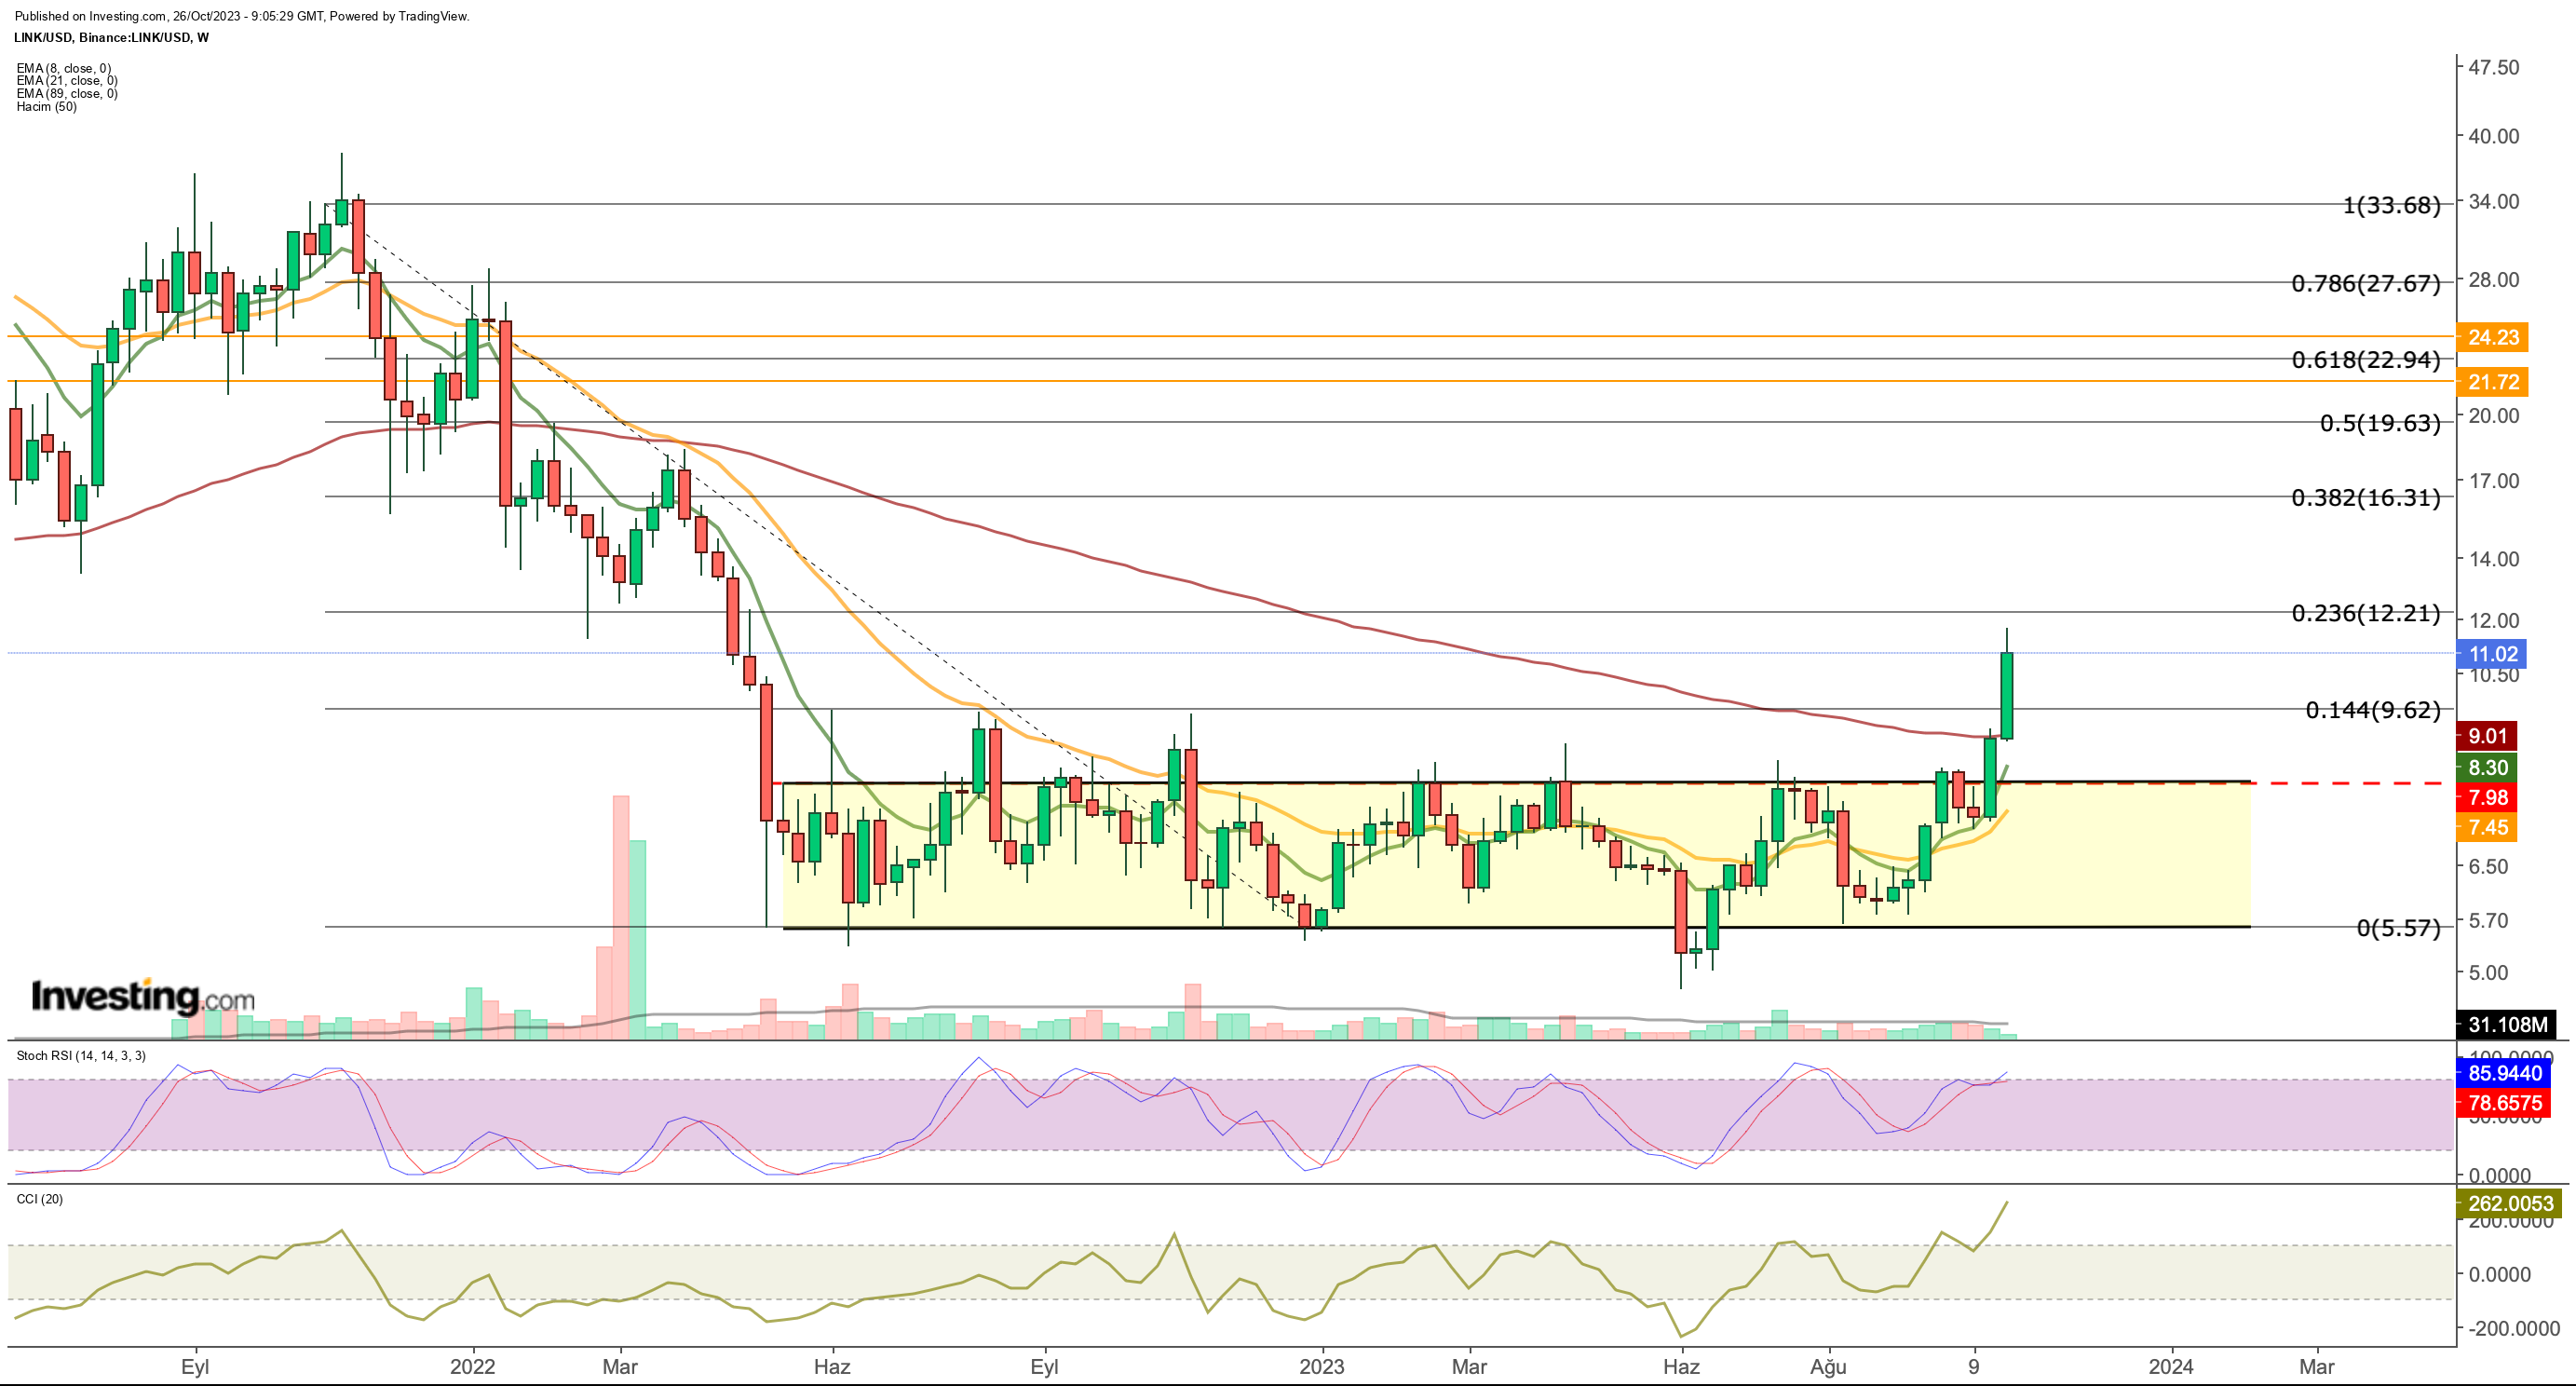
LINK, which is among the altcoins with rising trading volumes in recent days, has broken the sideways movement in the range of $5.5 - 8, which it has maintained since May 2022, in the last two weeks.
The crypto money, whose upward attempts last year were limited to the $9.5 level, can be considered an important move for the start of a new trend.
The cryptocurrency, which has appreciated by nearly 60% since last week, is now at $12.2, the closest point of resistance.
In a weekly closing above this resistance, which is calculated according to the long-term downtrend, it may become possible for the cryptocurrency to maintain its rise up to the $ 16 - $ 19 range.
If the week closes below the Fib 0.236 value at $ 12.2, we can see that the next move may be to test the $9 - 9.5 range as profit sales accelerate.
A retest to this level, followed by new purchases from support points, could ensure that the uptrend originating in June continues in a healthier way.
In the lower zone, failure to protect $9 in a possible pullback may invalidate the bullish setup and LINK may return to the sideways movement below $ 8.
Dogecoin Looks Set to Break Descending Channel
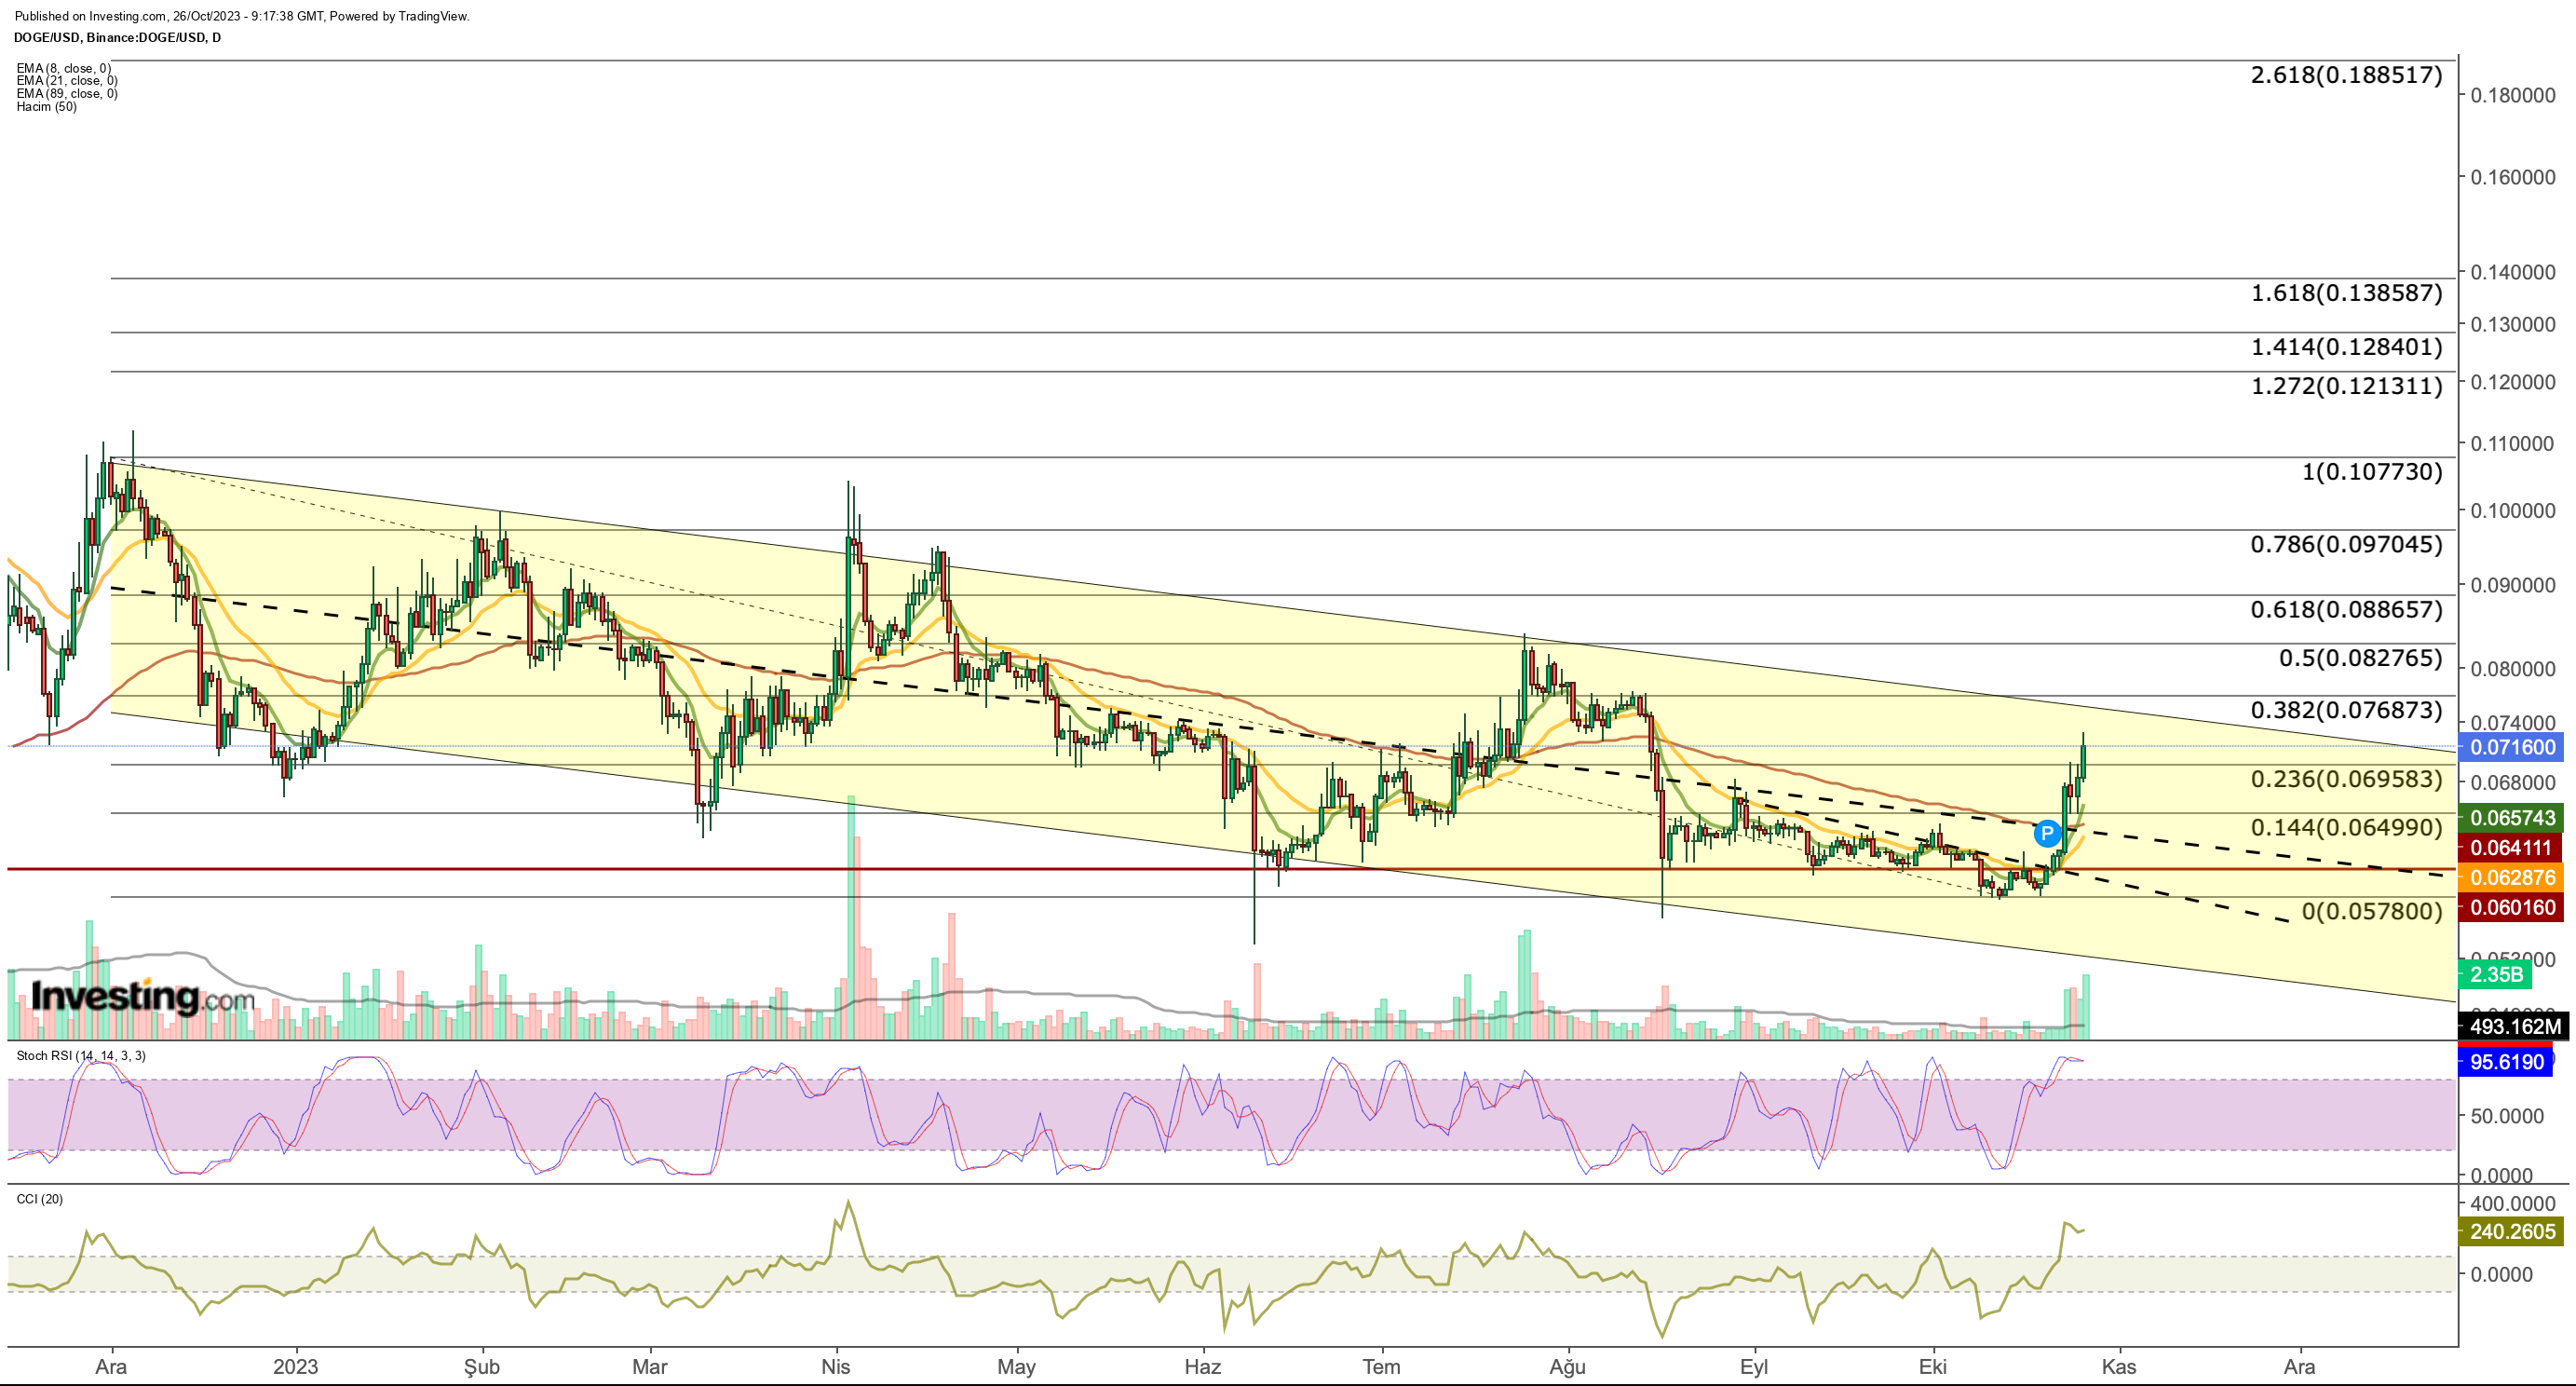
DOGE has been moving along a band throughout 2023, starting a bearish trend at the end of the year after volatile movements that started in October last year.
DOGE, which has had extremely low trading volumes since August, has made the average level of $0.06 as the main support. 
In the second half of October, DOGE, which broke the short-term downtrend in volume with the general market trend, rose as high as $0.072 with today's demand.
In 2023, the cryptocurrency, which exhibited a falling channel pattern, is seen to be moving to test the upper band of the channel in the current situation.
Accordingly, the $0.076 level will be followed as the first resistance for DOGE. In case of daily closes above this value, we can see that the cryptocurrency can move towards the range of $0.088 - $0.097.
In case of exhaustion in the uptrend, failure to break $0.076 may lead to a retracement within the channel towards $ 0.069.
Below this support, the EMA values at $0.064 constitute a second support line. On the other hand, the upward breakout trend of short-term EMA values can also be considered as a signal that will support the rise after passing the resistance of $0.076.
***
Disclaimer: This article is written for informational purposes only; it does not constitute a solicitation, offer, advice, counseling or recommendation to invest as such it is not intended to incentivize the purchase of assets in any way. I would like to remind you that any type of assets, is evaluated from multiple points of view and is highly risky and therefore, any investment decision and the associated risk remains with the investor.

