
This article was written exclusively for Investing.com
- The speculative biotech industry endured its worst historical drawdown over the last 16 months
- A recent thrust off long-term support creates a solid risk/reward setup for swing traders
- Still, a bearish seasonal trend is a headwind for this high-risk space
Biotech stocks were among the hardest hit during the severe pullback in speculation that began in early 2021. While the S&P 500 notched an all-time high in early January this year, many other parts of the equity markets were already well into bear territory. The downtrend continued through the first half of 2022. The SPDR® S&P Biotech ETF (NYSE:XBI) went through its worst drawdown since its inception—more dramatic than what was seen during the 2008 Great Financial Crisis.
XBI Fell More than 60% Off Its 2021 High

Source: Koyfin Charts
Over the last year, XBI is off a whopping 44%, sharply underperforming the broad stock market and the Health Care sector. Investors can play the industry in another way, though. The iShares Biotechnology ETF (NASDAQ:IBB) is a cap-weighted product whereas XBI is equal-weighted. In essence, XBI is small/mid-cap and IBB is large-cap.
Both XBI and IBB are down big over the last 12 months as the sector ETF is positive

Source: FinViz
But let’s dig into XBI. According to SSGA Funds, the ETF seeks to provide investment results that, before fees and expenses, correspond generally to the total return performance of the S&P Biotechnology Select Industry Index. XBI’s holdings are highly speculative. There are many niche drug manufacturers and therapeutic companies in the ETF. It’s a riskier vehicle to gain exposure to the biotech industry versus IBB.
SSGA reports that XBI’s price-to-earnings ratio is just 10.7 times next year’s forecast earnings. That’s incredibly cheap considering the sector’s P/E ratio is 15.6 times forward earnings, according to FactSet. The S&P 500’s next twelve-month earnings multiple is 15.8.
XBI Portfolio: Aggressive Constituents
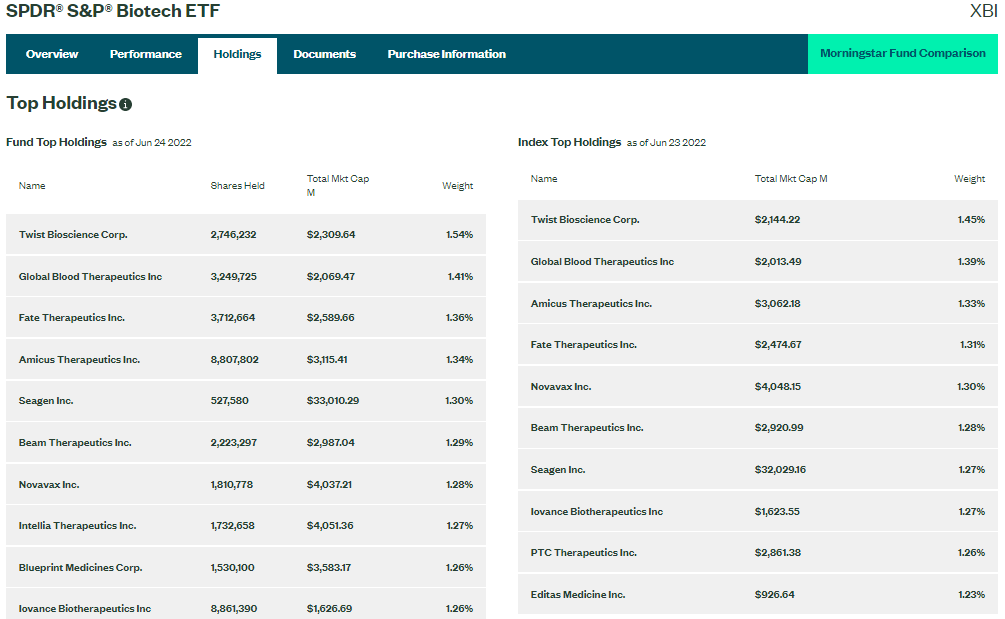
Source: SSGA Funds
So “SMID” cap biotech stocks look inexpensive based on earnings. But how do the technicals shape up? I see bullish trends, but not all vital signs are positive in this health care area. Seasonality, for example, tends to turn somewhat bearish (on a relative basis vs the S&P 500) in July, according to Equity Clock. As a technician, I know that seasonality should always come second to what price says, so let’s move on to XBI’s chart.
Biotech’s Seasonal Trend vs the S&P 500: Typically Tops Out in Q3
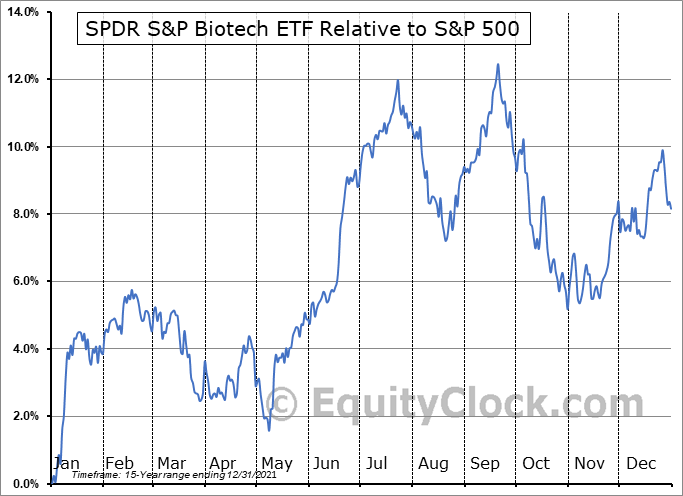
Source: Equity Clock
The five-year weekly chart on XBI is interesting right now. The stock was up each day last week, bouncing off a key range in the low $60s. Moreover, the weekly candle was a bullish marubozu – when the opening prints near the low of the period while the closing print is the high. So, we have a key spot on the downside to watch, but what about levels to the upside?
I see two key spots to take profits. The first is of longer-term significance around $100 on the chart below. The next level has been important more recently—the $118 to $121 area was pivotal from 3Q 2020 through early 2022. Watch those points as you play XBI from the long side.
XBI 5-Year Weekly Chart: Defined Support and Resistance Levels

Source: Stockcharts.com
The Bottom Line
Biotech might be back. A strong thrust off long-term support on the equal-weight XBI ETF suggests more upside could be on the way. Traders should always seek defined risk/reward situations, and this fits that bill. A stop below the May low is prudent while gains should be harvested as the fund approaches $100.