- Meme coins surged with inflation surprise, then tumbled on Fed comments.
- Dogecoin and Shiba Inu face critical support levels.
- Meanwhile, PEPE bucked the trend but needs to clear resistance for further gains.
- Invest like the big funds for under $9/month with our AI-powered ProPicks stock selection tool. Learn more here>>
Cryptocurrency markets went on a rollercoaster ride yesterday, reacting to both inflation data and the Fed.
First, a wave of optimism flooded the market as lower-than-expected inflation figures triggered an inflow of nearly $80 billion.
However, this positive atmosphere quickly evaporated after the Fed maintained interest rates, as expected, but Fed Chair Jerome Powell's comments triggered significant fund outflows.
Bitcoin initially charged towards $70,000, but Powell's statement that the Fed held no commitment to future rate cuts and would keep policy data-dependent sent prices tumbling.
Meme coins, known for their volatility, surged during the market swings.
Dogecoin, Shiba Inu, and PEPE/USD all saw some of the highest trading volumes among altcoins. However, all three currently sit at critical support levels. Let's analyze their price action one by one:
1. Dogecoin
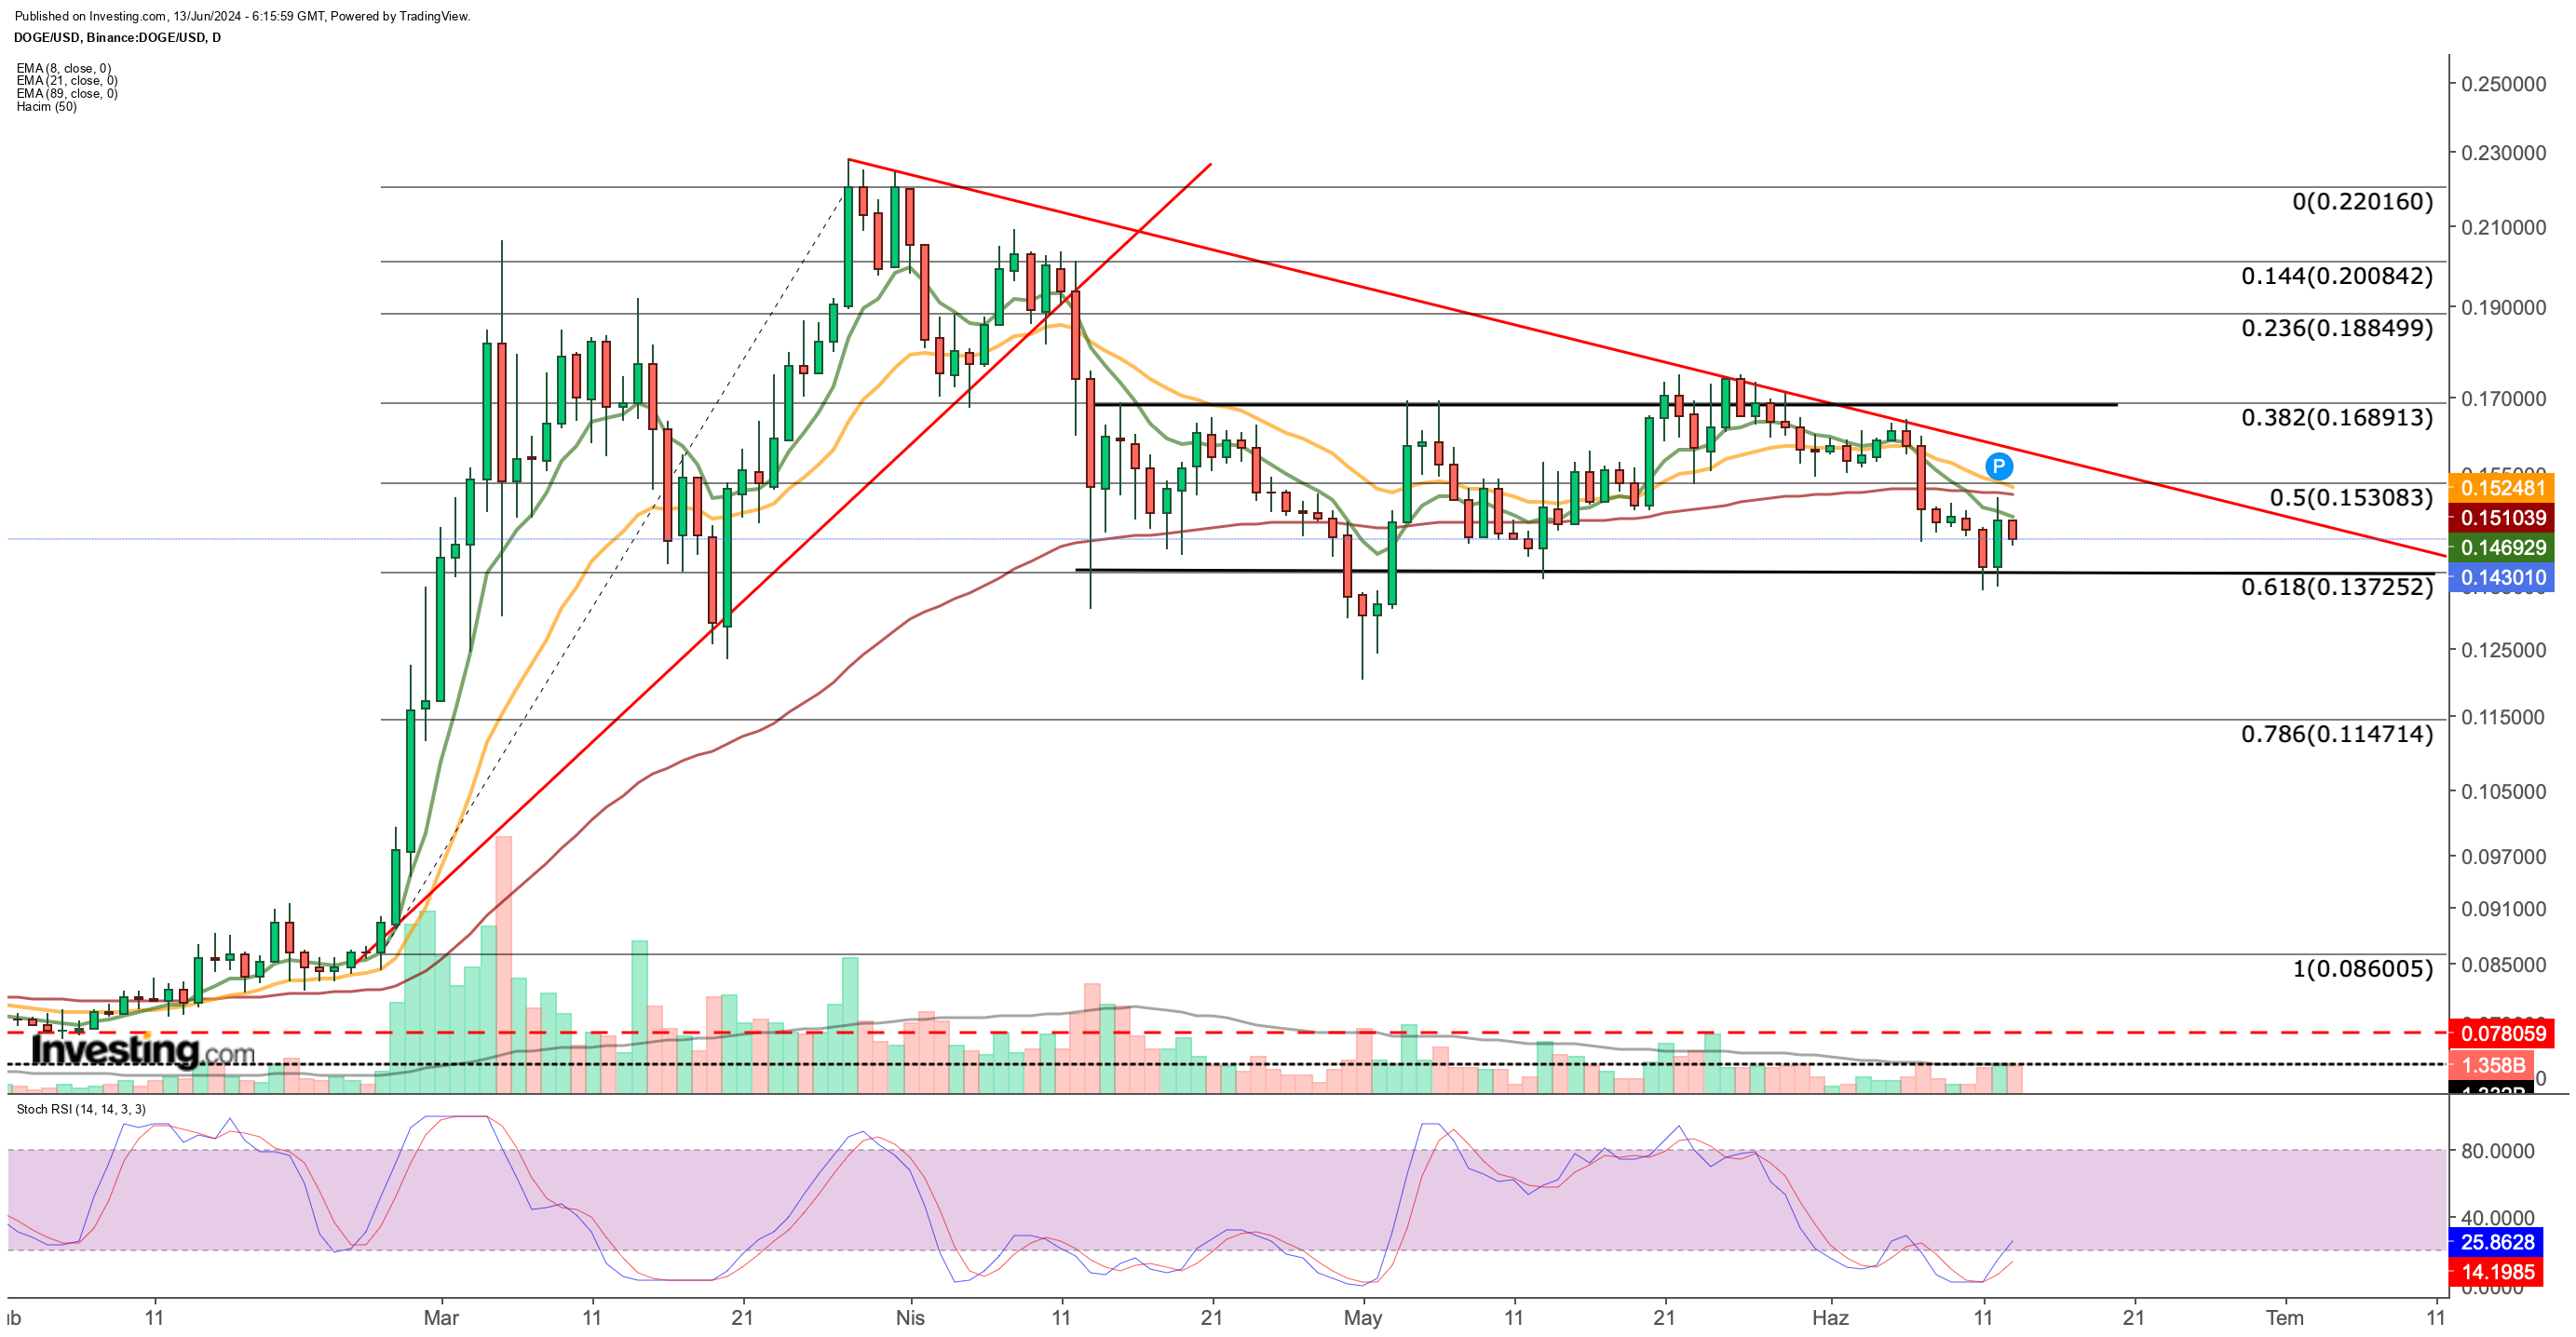
Dogecoin surged in the first quarter of 2024 but has since been stuck in a holding pattern. Over the past three months, the price has fluctuated within a 20% range.

DOGE faces resistance at $0.169, a level that has capped its gains for the past three months. However, dips below $0.137 are consistently met with buying pressure, suggesting support at this level. This week, DOGE successfully retested this support and appears to be holding firm.
Interestingly, the support level coincides with the 0.618 Fibonacci retracement level, calculated based on the prior uptrend. This technical confluence strengthens the possibility of a breakout from this consolidation zone.
However, for a true breakout to occur, DOGE needs to clear another hurdle: a cluster of exponential moving averages (EMAs) around $0.15.
If these EMAs, currently sloping downwards and signaling bearishness, remain unchallenged within the next week, selling pressure could mount. This could lead to a breakdown of the consolidation phase, potentially pushing DOGE down to the $0.11 zone.
On the other hand, a weekly close above the $0.155 level, where the EMAs are clustered, would be a significant bullish sign.
This would not only confirm a trend reversal but also represent a break of the downtrend that began in March, the year's high point. A breakout could attract more buyers and send DOGE sharply higher, potentially reaching the $0.2 band in the short term.
2. Shiba Inu
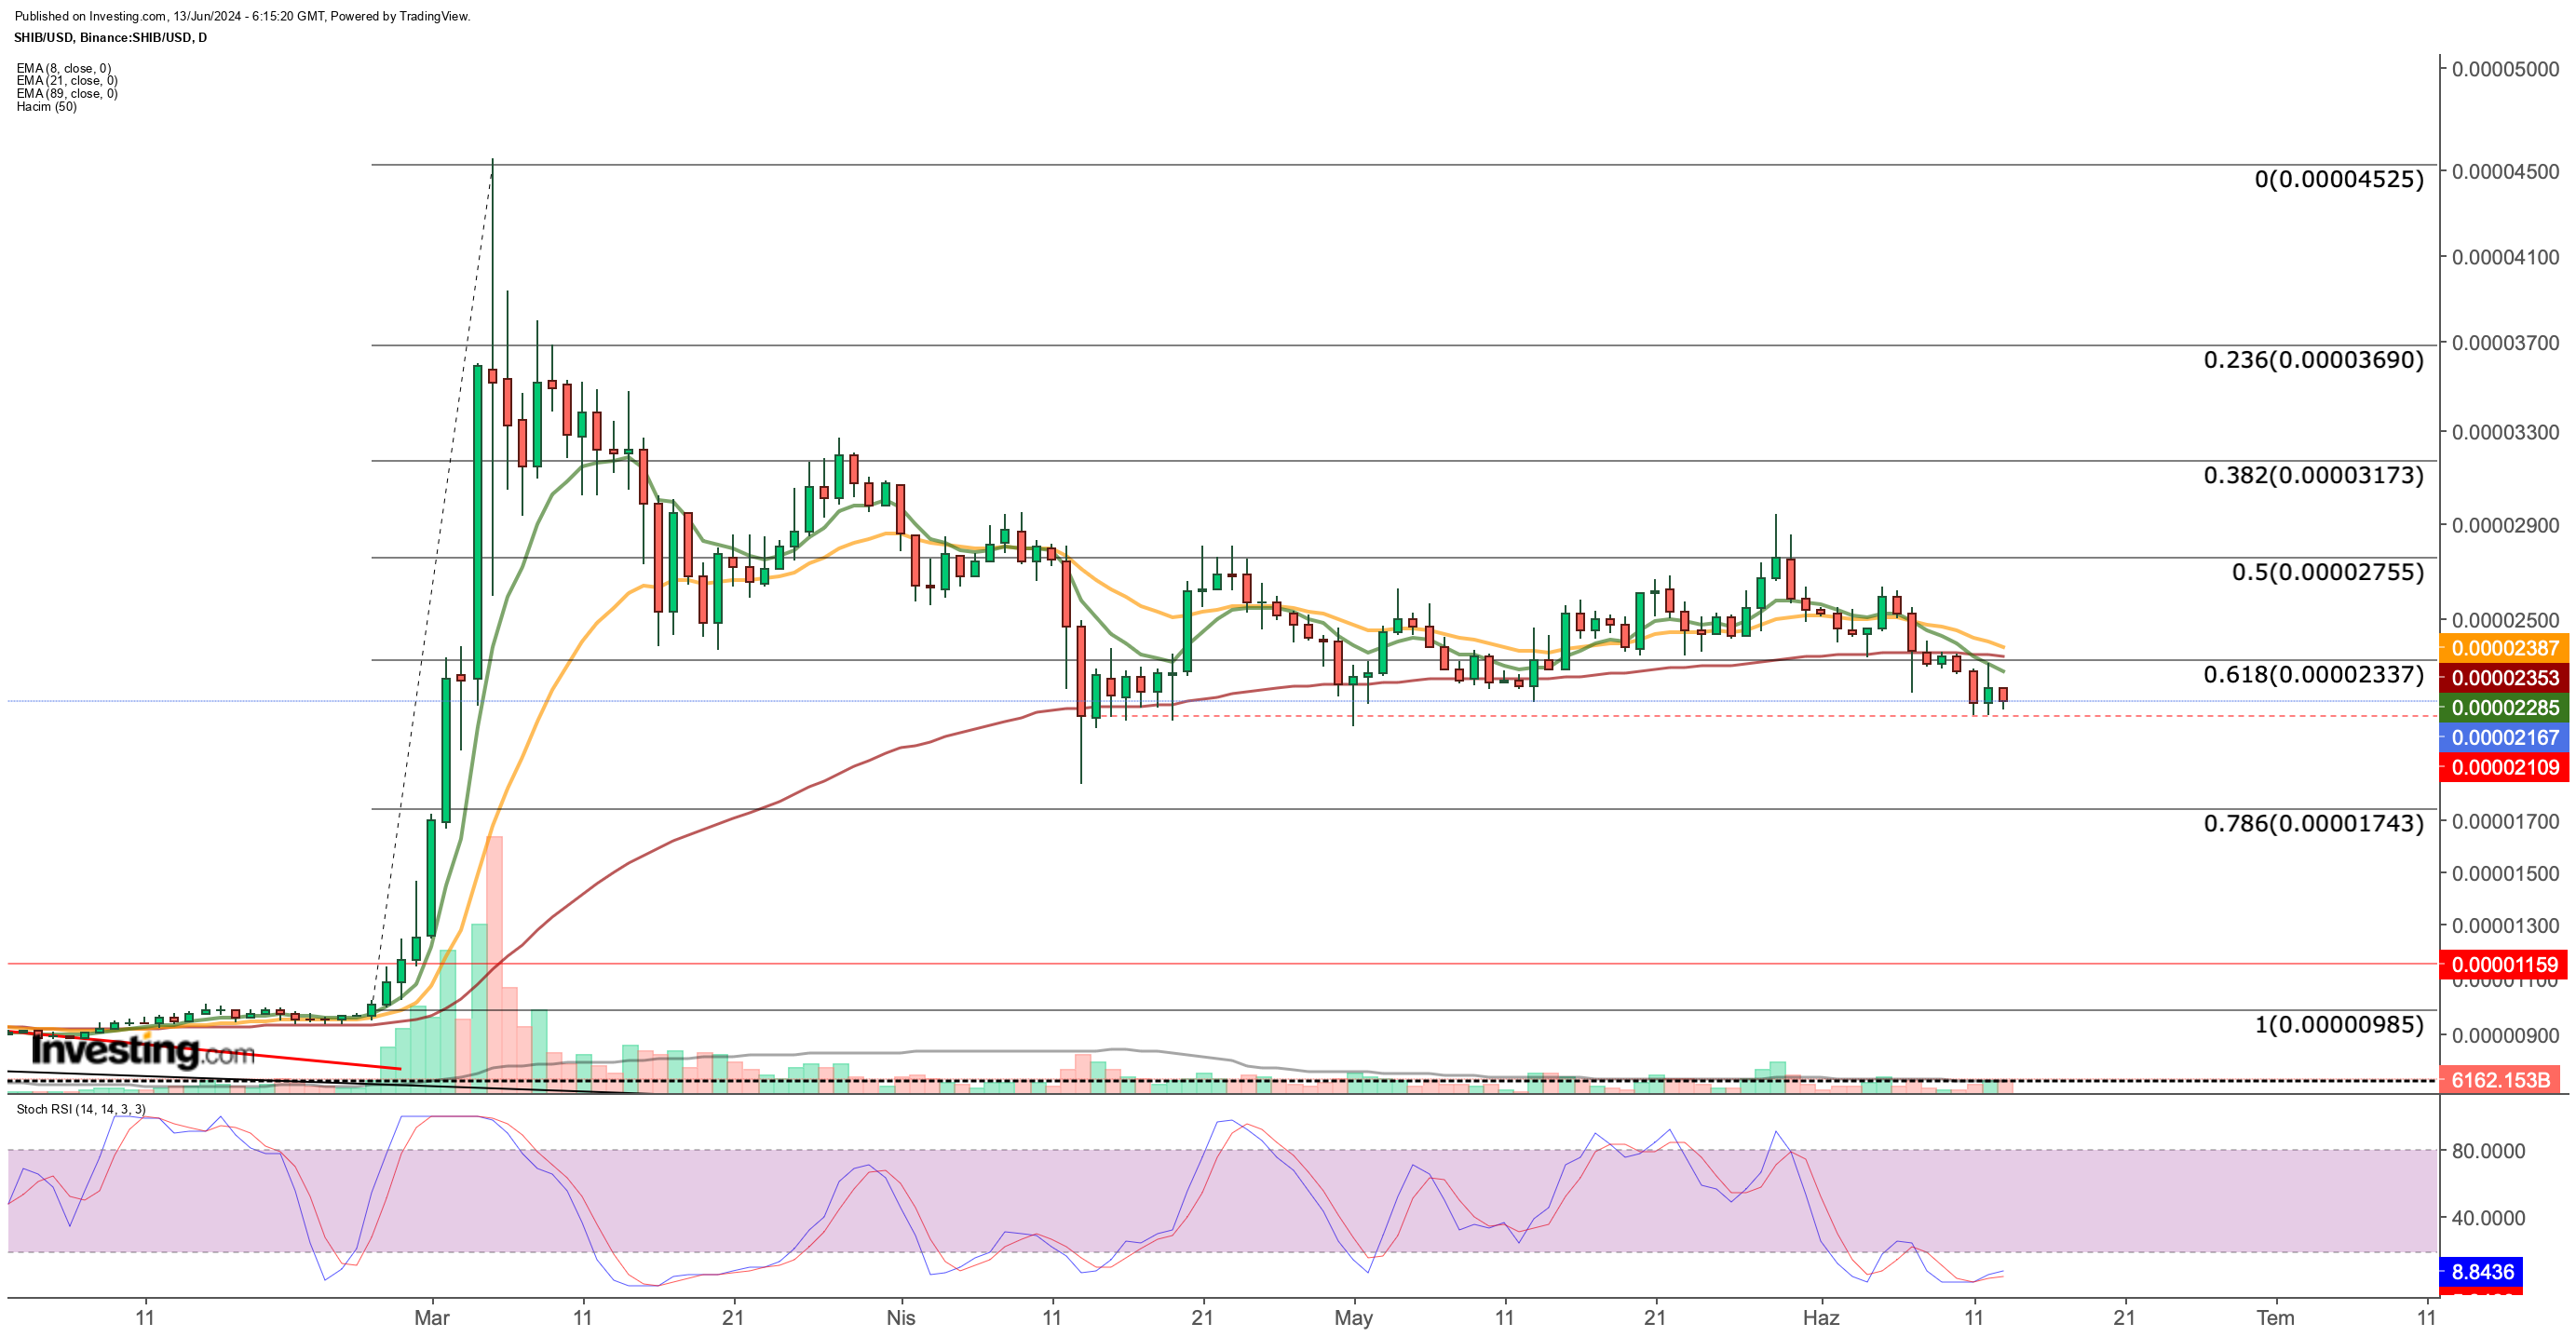
SHIB has emerged as one of the most stable meme coins in recent months. After a meteoric rise of over 350% in February-March, it entered a consolidation phase in April, giving back some gains but maintaining a defined trading range.

Currently, SHIB is hovering between $0.000021 and $0.000023. This week, it dipped below its initial support at $0.000023, but a secondary support level at $0.000021 seems to be holding firm. The direction of SHIB will likely depend on its weekly closing price relative to this support zone.
A break below $0.000021 could trigger selling pressure, potentially pushing SHIB back towards the $0.000017 level (Fibonacci 0.786 retracement). This breakdown would also be confirmed by a bearish crossover of short-term moving averages (EMAs), further amplifying the selling sentiment.
For a bullish scenario, a weekly close above $0.000023 is crucial. This could lead to a retest of the resistance at $0.000027. If a significant breakout occurs, accompanied by high trading volume, SHIB could target $0.000031 and $0.000037 in the short term.
3. PEPE
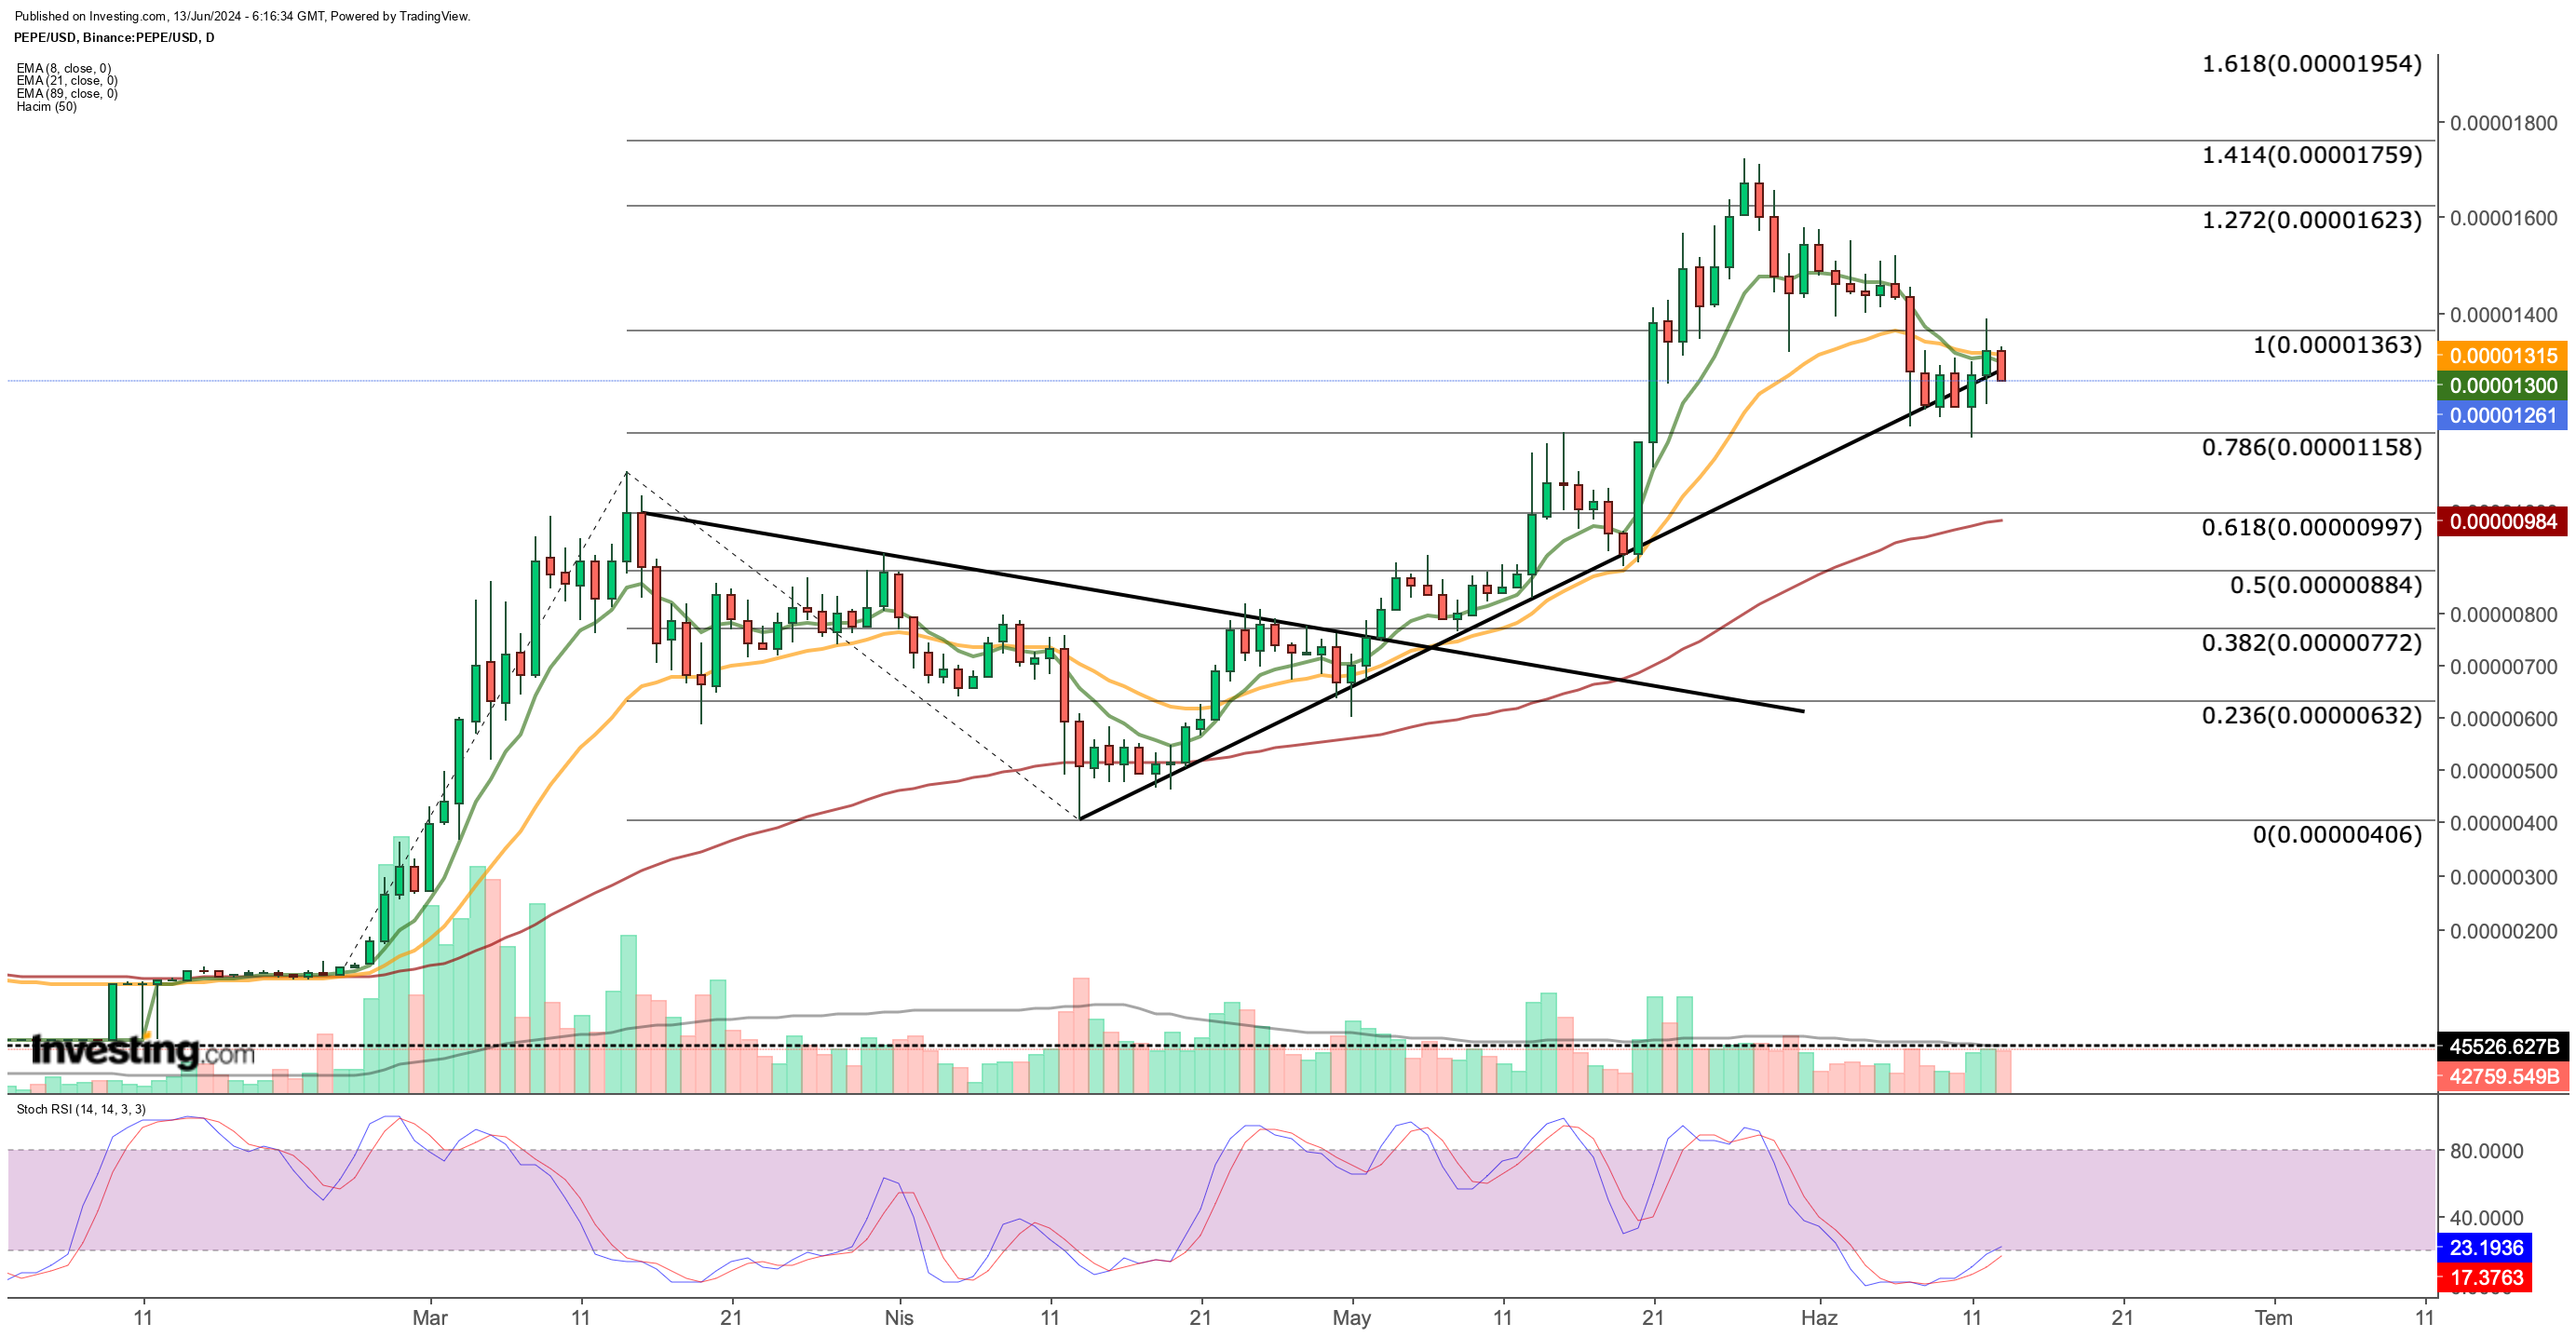
Unlike Dogecoin (DOGE) and Shiba Inu (SHIB), PEPE defied the downward trend in May. It surged steadily through April, reaching a record high of $0.00001722 before a slight pullback in the last few days.

PEPE's bullish momentum was fueled by a completed bullish setup at key Fibonacci expansion levels. However, profit-taking caused a dip to $0.000012. Thankfully, this decline was halted by a strong short-term rising trend line.
This reaction buying above the trend line hints at a potential resumption of PEPE's upward climb. A daily close above $0.000013 in the coming days would be a strong confirmation. This move would likely push the oversold Stochastic RSI indicator higher and bring the price back above the 8-day and 21-day EMAs – all bullish signals.
On the upside, a potential rebound could see PEPE clear the critical resistance level of $0.000015 and potentially reach new highs in the $0.000018-$0.000019 range.
However, a break below $0.00001160 on the daily chart would signal a trend reversal. This could lead to a prolonged correction and a possible short-term dip to the $0.000009 zone.
***
Take your investing game to the next level in 2024 with ProPicks
Institutions and billionaire investors worldwide are already well ahead of the game when it comes to AI-powered investing, extensively using, customizing, and developing it to bulk up their returns and minimize losses.
Now, InvestingPro users can do just the same from the comfort of their own homes with our new flagship AI-powered stock-picking tool: ProPicks.
With our six strategies, including the flagship "Tech Titans," which outperformed the market by a lofty 1,745% over the last decade, investors have the best selection of stocks in the market at the tip of their fingers every month.
Subscribe here and never miss a bull market again!

Don't forget your free gift! Use coupon codes OAPRO1 and OAPRO2 at checkout to claim an extra 10% off on the Pro yearly and bi-yearly plans.
Disclaimer: This article is written for informational purposes only; it does not constitute a solicitation, offer, advice, or recommendation to invest as such it is not intended to incentivize the purchase of assets in any way. I would like to remind you that any type of asset, is evaluated from multiple points of view and is highly risky and therefore, any investment decision and the associated risk remains with the investor.
